


Process map
This function allows you to prepare a defined map for plotting.
To run this function: Choose Plotting > Process > Map, or...
After entities and maps are defined, the definition is held in a library. When you want to produce a given map; you simply choose Process Map and nominate the map definition by name. The specified data are gathered from the named files and are used to prepare the final map sheet.
The end result of processing a defined map is a plot file (.dwf) which contains a plotter-independent representation of the final map. The name of the file is formed from the leading five characters of the defined map name, a consecutive alphabetical character and a file extension, .dwf. During preparation of the plot file, any symbols or text clashed off the plot are written to a .cf file with the same name as the current plot. For example, a map definition called contour will produce a file called contoa.dwf the first time it is processed, then contob.dwf the second time and so on.
When you ruin this function, the Process existing map definitions form is displayed.
 Note: You can process multiple map definitions and have them all plot on a single sheet.
For example, for plotting multiple borehole sections on a sheet, or section and plan views of the same data on a single sheet.
To do this, you enter the names of each of the maps to be processed on as many lines as necessary in the scrolling region of the Process Existing Map Definitions form.
Separate presentation parameters will be requested for each map, allowing each one to be assigned to a separate defined drawing area on the selected sheet.
Note: You can process multiple map definitions and have them all plot on a single sheet.
For example, for plotting multiple borehole sections on a sheet, or section and plan views of the same data on a single sheet.
To do this, you enter the names of each of the maps to be processed on as many lines as necessary in the scrolling region of the Process Existing Map Definitions form.
Separate presentation parameters will be requested for each map, allowing each one to be assigned to a separate defined drawing area on the selected sheet.
After the Process Existing Map Definitions form is applied, the Plot Presentation Parameters form is displayed. You can use this form to alter any of the plot presentation parameters to ensure that the map has the appropriate scale, the correct sheet size, and the correct title block. The first time a map is processed, default values for the sheet setup characteristics are obtained from the defaults.ssi file. You may alter these values to suit your preferences as required. On successful processing of a map, various items of data are retained in intermediate files so that when that same map is processed at a later time, the values previously entered will be re-used in preference to the values from the defaults.ssi file.
Pre-defined sheet entities
Map presentation refers to those elements which are plotted on a map sheet but which are not read from string or note files. These elements of the plot are called sheet entities. Sheet entities include:
These sheet entities are defined in a number of files in the SSI_PLOTTING: directory. New software installations are supplied with a suite of sheet entities sufficient for creating maps for most purposes. Additional sheet entities can be easily created using the suite of functions provided for managing sheet setup characteristics. Each sheet entity is given a unique name and it is referred to by using this name when processing maps.
 Border definitions
Altering Presentation Parameters
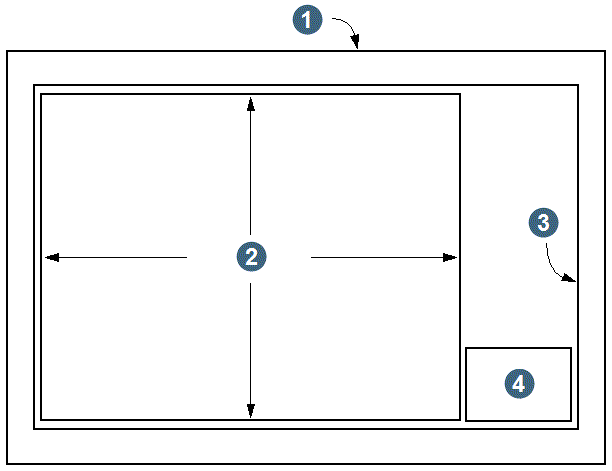
A plot sheet is viewed as having the following basic attributes, all of which are defined in the sheet setup files in the SSI_PLOTTING directory.
|
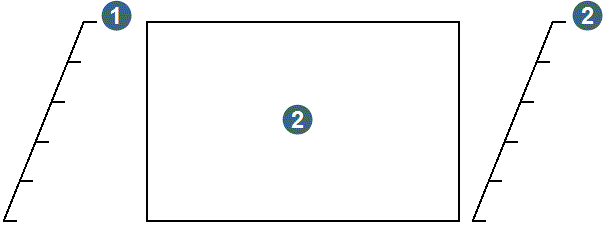
1. Sheet 2. Drawing area 3. Border 4. Title block |
Plotting of string, image and note data are restricted to within the drawing area. Data which will not fit in this area at the nominated orientation and scale will be clipped off and ignored.
The border and drawing area sizes are defined relative to the sheet edges, and so the same border and drawing area definitions may be used on sheets of any size. The drawing area may be defined as any size up to and including the same area as the border.
Any of the plot presentation parameters may be altered to achieve the desired result. To aid you in choosing the appropriate plot presentation parameters the data extents and minimum scales to suit each defined sheet size, for the chosen drawing area, are displayed.
Data extents, Minimum and Maximum Y and X
The extents of the data processed for the map are displayed. This is useful in providing a quick check to ensure that the correct data have been processed.
Sheet sizes and minimum map scales
For each defined sheet size, the minimum scale necessary to ensure all data will appear on the map for the most commonly used orientations, Landscape Centred and Portrait Centred, are displayed. The scales are interpreted differently depending on the value of the Data units field.
If the data units are:
- Metric - The scales are interpreted as 1 : scale value
- Imperial - The scales are interpreted as 1 inch = scale value feet.
Each of the presentation aspects on the Plot Presentation Parameters form are described below. Together they define the final presented appearance of the plot. The sheet entity identifiers, e.g. BORD, DRAW, YXA3, and NMA3 shown above, relate to sheet entities created and managed using the Sheet Setup functions.
If you have selected to process multiple maps onto a single sheet, the Plot Presentation Parameters form is displayed for each of the maps that have been selected.
Fields on the Plot presentation parameters form
| Field | Description |
|---|---|
| Map name |
The name of a map which exists in the plotting library. |
| Output file name |
The name of the output plot file.
|
| Field | Description |
|---|---|
| Minimum scale to fit data | The minimum scale required to produce a plot containing all data within the data extents. This value replaces the scale lookup table used by Autoplot in previous versions of the software. It is calculated using the currently selected sheet, orientation, data unitsand also the plan strip option. |
| Lock X/Y scale | Controls the appearance of the Scale field. Normally, the scale used is the same in both the X and Y directions, and in this case you should select this option. Then you can enter a single value in the Scale field. However, if a different Y scale is required, clear this option, and separate fields are provided for the X and Y scales. |
| Scale | Controls the scale of the plotted data. |
| Sheet size |
The sheet size for your plot.
The sizes of sheets may be changed and new sheets added by using the Plot Sheet Sizes function from the Plotting menu.
|
| Border |
The border style for your plot. If you do not want a border, leave this field blank. Borders may be changed and new borders added by using the Plot Borders function from the Plotting menu. A border is defined relative to the edges of the selected sheet size thus permitting the same border to be used for any sheet size. The maximum border area is the sheet size, but may be some fixed distance in from each edge, for example, 1 cm all around the sheet.
|
| Drawing area |
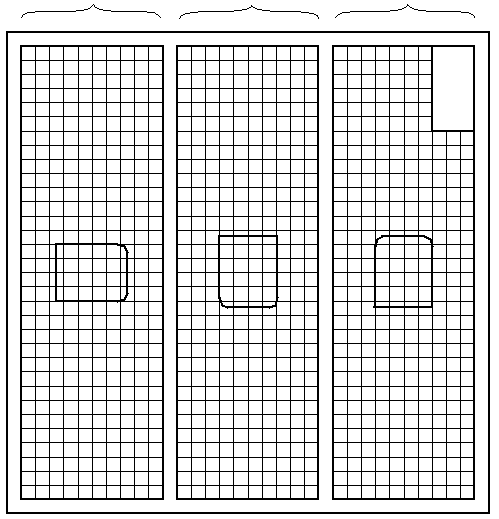
The only area string and note data is plotted. This area is a subset of the area contained within the border. Typically this is 1 mm inside the border all round. However, it is also common to define the right-most edge of the drawing area to be inside the title block, leaving a blank panel above the title block as illustrated in this diagram. Different drawing area definitions are given unique names, and are created and managed using the Plot Drawing Areas function on the Plotting menu. The Plotting module permits multiple maps to be processed such that all are drawn onto the same sheet of paper. To achieve this, a drawing area must be defined for each part of the sheet of paper into which the map data is to be drawn. For example, the following illustration shows how three different maps may be 'stacked' on an A1 sheet using three standard drawing area definitions supplied. You may devise others to plot side by side, or on different sheet sizes. |
| Grid |
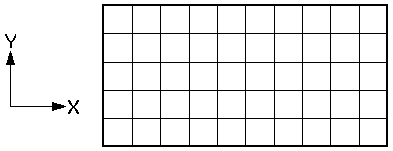
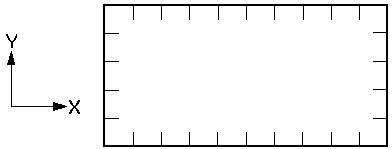
The grid to display with your plot. If you do not want a grid, leave this field blank. A number of grid definitions are supplied at installation. These pre-defined grids are described above. The presentation of grid lines and labels on a map are determined by the grid definitions that are managed by the Plot Grids function on the Plotting menu. Additional grids may be defined as required using the Plot Grids function. The Grid Line Spacing and Grid Style form will be displayed if you defined a Grid in the Plot Presentation Parameters form. Different line types may be plotted in each of the Y and X directions. |
| Title block |
The title block for your map. If you do not want a title block, leave this field blank.
A number of pre-defined title blocks are provided when the software is installed. The Plot Title Blocks function on the Plotting menu can be used to manage these title blocks and to create new title blocks and to modify existing title blocks. If a title block has been specified then the User Definable Title Block Lines form will be displayed so that you can define each of the title lines for your title block. |
| Plot orientation |
The orientation of your plot on the sheet. Orientations you can choose. |
| Quadrant |
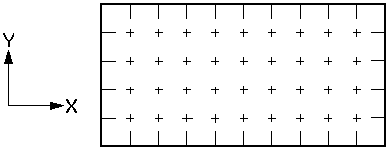
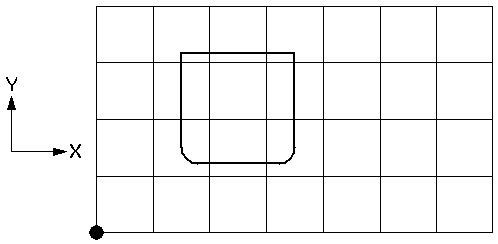
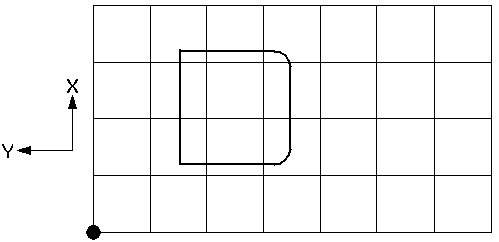
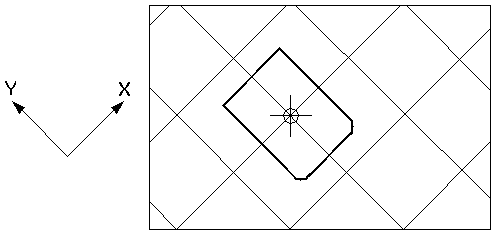
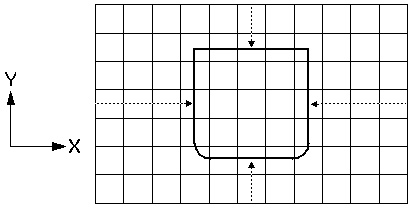
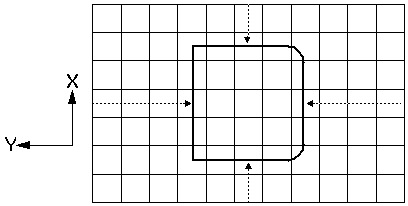
The coordinate system for the map. The different quadrants are used to determine the orientation of the reference direction. The reference direction, the positive Y direction (North for plan data), typically travels from the bottom to the top of the map sheet. This is the North-East quadrant which is the way most plots are processed. The list below shows the effect the different quadrants have on the orientation of the reference direction.
|
| Data units |
The system of measurement for your map data.
|
| Overprint |
|
| Text rotation |
|
| Display plot after processing |
|
| Save current settings as default | Saves the settings on this form as default plotting settings (for this file only or for all files in default.ssi?). |
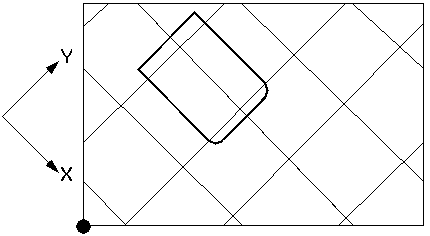
Note: This tab is only active if you have chosen blank, NOGR or any of the oblique grid definitions on the Plot Parameters tab, in the Grid field.
| Field | Description |
|---|---|
| Plot Northing and Easting grid lines |
|
| Section file | The file that contains the section line definition point. |
| Section line string number |
The string number for the section line.
|
| Grid | The grid used to display Northing and Easting lines on the plot. By default, the OBLIQUE SECTION grid is specified. |
| Type |
The type of grid that you want plotted for the Northing and Easting directions.
|
| Interval | The space between grid lines. |
Note: You can plot your oblique section with real world X, Y and Z grid lines by selecting OBA3 in the Grid field, on the Plot Parameters tab, and selecting OBLIQUE SECTION in the Grid field, on the Oblique Section Grid tab.
You will need to enter parameters for the Z grid lines, in the YInterval and Type fields, on the Grid Line Spacing and Grid Style form that displays when you have accepted the parameters on the Plot presentation parameters form.
Result
A device independent plot file that contains the necessary plotting commands to display the plot on the screen or to output the plot to a hardcopy plot device.
Further Processing
On completion of processing a map you can use the Plot Preview function to graphically preview the map that has been created to ensure that the desired results are achieved. Alternatively, you may elect to use the Plot Driver function to submit the plot to one of the supported hardcopy devices.