


Plot grids
Most maps have a grid of some form drawn to aid in interpreting the contents of the map. The manner of presenting the grid on the map varies with the requirements of the map creator. The PLOT GRIDS function opens the Plot Sheet Setup form so you can work with grids.
Function Name:
The variations commonly found in grids are:
- The line style and colour for the grid lines
- The grid annotations may have some special prefix or suffix
- The frequency of the grid lines and annotations
These and many other features may be defined for a grid so that a suitable grid can be placed on hard copy maps when using the Process Map function.
All grids are defined in the SSI_PLOTTING:grids.ssi file. The PLOT GRIDS function provides an interactive graphics viewing and editing environment to create, modify and delete grid definitions. Each grid that is created, or selected for modification is displayed in a graphics viewport. Changes may be made to the grid definition by viewing and modifying the grid properties in a dialog form.
While working in this environment you may choose to display, create, modify and delete other sheet setup features such as borders, drawing areas and title blocks by choosing the menu for the appropriate feature.
The following commands related to grids are available.
| Command | Description |
|---|---|
| Titles | Displays the menu for managing title block definitions |
| Draw Areas | Displays the menu for managing drawing areas |
| New | Allows you to create a new grid definition |
| Select | Allows you to select an existing grid definition and display it in a new graphics viewport |
| Copy | Allows you to create a new grid definition by copying an existing grid and displaying it in a new viewport |
| Delete | Allows you to delete a grid definition |
| Save | Allows you to save all grid definitions to the SSI_PLOTTING:grids.ssi file |
| Properties | Allows you to display the properties of borders, drawing areas, grids or title blocks in a dialogue form for viewing or editing purposes |
| Pan | Allows you to move the image of the drawing area around by using the mouse to define the amount of displacement |
| Window In | Allows you to enlarge a portion of the displayed drawing area by using the mouse to define the region of interest |
| Window Out | Undoes the effect of the most recent Window In operation |
| Zoom In | Allows you to enlarge the displayed part of the drawing area by a factor of 2 |
| Zoom Out | Allows you to reduce the size of the displayed part of the drawing area by a factor of 2 |
| Zoom All | Displays the entire drawing area definition in the active viewport. |
| EXIT | Allows you to exit from the Plotting Sheet Setup module without saving any changes |
| EXIT & SAVE | Allows you to exit from the Plotting Sheet Setup module and ensures that any changes are saved. |
Helpful Hints
When using the Grid management functions for the first time you will find it easiest to select an existing grid and examine its properties. You can modify the properties of the grid to suit your requirements.
Select grid
This function permits you to select an existing grid definition and display it in a graphics viewport. After displaying the grid in the viewport you can examine or alter its properties using a form.
To run this function: In the Plot Sheet Setup window, choose Grids > Select, or...
- With the Plot Sheet Setup window open, in the Function Chooser, type PLOT SELECT GRID, and press ENTER.
Fields on the Select plotting grid form
Grid ID
Choose the grid that you wish to display in a graphics viewport.
Border ID, Draw Area ID
Hardcopy maps typically have a border and drawing area with the grid displayed inside the drawing area. To place the grid in context, you must choose the border and drawing area that are to be used to display the grid in the graphics viewport.
Even though you may choose a particular border and drawing area here to display the grid, this has no impact on the border and drawing area that may be used when using the Process Map function. The sheet size that is used to display the grid definition in the graphics viewport is the preferred sheet size of the chosen drawing area.
Result
The grid that you have chosen is displayed in a graphics viewport with the requested border and drawing area.
New grid
This function allows you to create a new grid definition. Grid definitions permit you to define the characteristics of the X grid lines and annotations and the Y grid lines and annotations independently.
To run this function: In the Plot Sheet Setup window, choose Grids > New, or...
- With the Plot Sheet Setup window open, in the Function Chooser, type PLOT NEW GRID, and press ENTER.
Fields on the New grid properties form
The parameters required for each of the grid directions are identical and so they will be described just once.
Grid ID
The name of the new grid must be entered here. You may use any characters in the name excluding the comma (,) character. The grid name must be unique as it is used later to select the grid by name from the list of known grids.
Grid names are case sensitive.
Grid description
The grid description is optional and is used to give a more verbose description of the purpose for which the grid is used.
Border ID, Draw Area ID
Hardcopy maps typically have a border and drawing area with the grid displayed inside the drawing area. To place the grid in context, you must choose the border and drawing area that are to be used to display the grid in the graphics viewport.
Even though you may choose a particular border and drawing area here to display the grid, this has no impact on the border and drawing area that may be used when using the Process Map function. The sheet size that is used to display the grid definition in the graphics viewport is the preferred sheet size of the chosen drawing area.
X and Y Grid line properties
Pen number
The lines, ticks or crosses and labels that are drawn on the map for the grid are drawn with a specified pen number. Each pen is associated with a colour through a pen file that can be easily modified to suit your requirements.
Default interval
When entering the grid parameters while processing a map, the interval between grid lines must be supplied. The values entered in this field determines the default value for the grid line intervals.
By entering a value of zero in this field, the Process Map function will choose a grid line interval that is:
- map scale * 0.1 if the map is using metric units
- map scale * 2.0 if the map is using imperial units
The map scale referred to is the X or Y scale as appropriate for the grid lines in question.
If a non-zero value is entered in this field (a positive value that is) then it is this value that will be displayed as the default grid line interval when processing the map.
It is most common to use a value of zero for this field.
Style
The grid lines may be drawn in one of three different styles. These styles are:
- lines
- ticks
- crosses
Solid lines that extend the full width, or height, of the drawing area.
Tick marks around the perimiter of the drawing area only.
Crosses throughout the drawing area region and tick marks around the perimeter of the drawing area.
The size of the tick marks and crosses is determined by the tick size parameter.
Priority
Each item, line, text, symbol, etc. that is drawn on a map has a priority that is used to determine how items that clash should be drawn, or omitted. The value entered here is the priority of the grid lines/crosses/ticks only.
Tick size
When the grid line style is either ticks or crosses, the value entered here determines how large those crosses or tick marks are. The tick size is expressed in units of centimetres.
Offset
This value is used to determine the starting value for the grid lines. Normally it is zero and so a grid line interval of 100 will result in grid lines at values of 100, 200, 300, etc.
If you require grid lines at some unusual values, the offset can be used to assist. If for example you require grid lines at intervals of 100 but situated at values of 125, 225, 325, 425, etc. you can achieve this by using an offset value of 25.
X and Y Text location properties
Labels at
Grid line labels may be placed on the map, or not, to suit your requirements. There are 4 alternatives available to determine the placement of the grid line labels. These are:
- both ends
- start
- end
- none
This is the most commonly used alternative and ensures that grid labels are placed at both ends of the grid lines, provided of course that they are not clashed off the map by other features of higher priority on the map.
Labels are only placed at the start of the grid line. For horizontal grid lines the start is at the left edge of the drawing area. For vertical grid lines the start is at the bottom edge of the drawing area.
Labels are only placed at the end of the grid line. For horizontal grid lines the end is at the right edge of the drawing area. For vertical grid lines the end is at the top edge of the drawing area.
Grid labels are not drawn at either end of the grid lines.
Interval
The label interval determines the frequency of labels on the grid lines. Only those grid lines whose grid value is an integral multiple of the label interval will have labels. The default value of 1 ensures that all grid lines will have labels.
A label interval of 100 though will ensure that only grid lines whose value is an integral multiple of 100 will have labels drawn. With such a grid line interval you could therefore have a map with grid lines at values of 100, 125, 150, 175 and 200 but only have labels drawn on the 100 and 200 grid lines.
Horizontal offset, Vertical offset
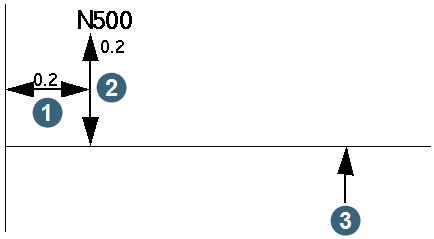
The horizontal and vertical offsets determine the placement of the grid line label with respect to the edge of the drawing area and the grid line. The diagram below shows the relationship of the grid line label, the grid line and the drawing area extent with the horizontal and vertical offsets.
|
1. horizontal offset 2. vertical offset 3. grid line |
The horizontal offset is measured away (towards the interior of the drawing area) from the closest drawing area edge. The vertical offset is measured perpendicular to the grid line, above it for horizontal lines and to the left of it for vertical grid lines.
X and Y Text presentation properties
Number sign
Whether a sign is placed with the grid value is determined by the value entered in this field. You may choose from:
- normal
- explicit
- none
Normal number sign conventions are used. That is, a preceeding negative sign is used for negative numbers and no sign is used for positive numbers.
A preceeding sign is always used for both negative and positive numbers.
No number sign is used regardless of whether the number is negative of positive.
No. decimals
The number of decimal places that are used to format the grid line value is determined by the value entered here. You may choose from:
- -1
- 0
- 1
- 2
- 3
No decimal places and no decimal point either.
No decimal places are used but a decimal point is.
The number will be formatted with decimal place.
The number will be formatted with 2 decimal places.
The number will be formatted with 3 decimal places.
Prefix
The grid line label may have a some characters placed before the numeric value. An example of this might be, Easting = 2500. A single space is used to separate the prefix and the numeric grid line value. If you do not require a prefix then leave this field blank.
Suffix
The grid line label may have a some characters placed after the numeric value. An example of this might be, 2500 East. A single space is used to separate the suffix and the numeric grid line value. If you do not require a suffix then leave this field blank.
Priority
Each item, line, text, symbol, etc. that is drawn on a map has a priority that is used to determine how items that clash should be drawn, or omitted. The value entered here is the priority of the grid label only.
Font options
Name
Select the font name.
Bold
Check this box for bold text.
Italic
Check this box for text in italics.
Underline
Check this box for underlined text.
Height (cm)
This is the height, in centimetres, of the grid line labels that will be drawn on the map.
Note: There are some minor known issues with fonts and the plot previewer.
Complete the NEW GRID PROPERTIES form and choose Apply to present the new grid definition in a graphics viewport.
Copy grid
This function permits you to create a new grid by copying an existing grid definition. You might choose to use this method if you wish to create a new grid definition that is only slightly different to an existing grid definition.
Grid definitions permit you to define the characteristics of the X grid lines and annotations and the Y grid lines and annotations independently.
To run this function: In the Plot Sheet Setup window, choose Grids > Copy, or...
- With the Plot Sheet Setup window open, in the Function Chooser, type PLOT COPY GRID, and press ENTER.
Fields on the Copy grid properties form
The parameters required for each of the grid directions are identical and so they are described just once.
Existing Grid ID
Choose the name of the existing grid definition that you wish to copy when creating a new grid definition. After choosing the existing grid name and pressing the enter key, the properties of the exiting grid are displayed in the appropriate fields.
New Grid ID
The name of the new grid must be entered here. You may use any characters in the name excluding the comma (,) character. The grid name must be unique as it is used later to select the grid area by name from the list of known grids.
Grid names are case sensitive.
Grid Description
The grid description is optional and is used to give a more verbose description of the purpose for which the grid is used.
Border ID, Draw Area ID
Hardcopy maps typically have a border and drawing area with the grid displayed inside the drawing area. To place the grid in context, you must choose the border and drawing area that are to be used to display the grid in the graphics viewport.
Even though you may choose a particular border and drawing area here to display the grid, this has no impact on the border and drawing area that may be used when using the Process Map function. The sheet size that is used to display the grid definition in the graphics viewport is the preferred sheet size of the chosen drawing area.
X and Y Grid line properties
Pen number
The lines, ticks or crosses and labels that are drawn on the map for the grid are drawn with a specified pen number. Each pen is associated with a colour through a pen file that can be easily modified to suit your requirements.
Default interval
When entering the grid parameters while processing a map, the interval between grid lines must be supplied. The values entered in this field determines the default value for the grid line intervals.
By entering a value of zero in this field, the Process Map function will choose a grid line interval that is:
- map scale * 0.1 if the map is using metric units
- map scale * 2.0 if the map is using imperial units
The map scale referred to is the X or Y scale as appropriate for the grid lines in question.
If a non-zero value is entered in this field (a positive value that is) then it is this value that will be displayed as the default grid line interval when processing the map.
It is most common to use a value of zero for this field.
Style
The grid lines may be drawn in one of three different styles. These styles are:
- lines
- ticks
- crosses
Solid lines that extend the full width, or height, of the drawing area.
Tick marks around the perimiter of the drawing area only.
Crosses throughout the drawing area region and tick marks around the perimeter of the drawing area.
The size of the tick marks and crosses is determined by the tick size parameter. The value entered here is used as the default value when entering the grid parameters when processing a map. This value can be changed when processing a map if required.
Priority
Each item, line, text, symbol, etc. that is drawn on a map has a priority that is used to determine how items that clash should be drawn, or omitted. The value entered here is the priority of the grid lines/crosses/ticks only.
Tick size
When the grid line style is either ticks or crosses, the value entered here determines how large those crosses or tick marks are. The tick size is expressed in units of centimetres.
Offset
This value is used to determine the starting value for the grid lines. Normally it is zero and so a grid line interval of 100 will result in grid lines at values of 100, 200, 300, etc.
If you require grid lines at some unusual values, the offset can be used to assist. If for example you require grid lines at intervals of 100 but situated at values of 125, 225, 325, 425, etc. you can achieve this by using an offset value of 25.
X and Y Text location properties
Labels at
Grid line labels may be placed on the map, or not, to suit your requirements. There are 4 alternatives available to determine the placement of the grid line labels. These are:
- both ends
- start
- end
- none
This is the most commonly used alternative and ensures that grid labels are placed at both ends of the grid lines, provided of course that they are not clashed off the map by other features of higher priority on the map.
Labels are only placed at the start of the grid line. For horizontal grid lines the start is at the left edge of the drawing area. For vertical grid lines the start is at the bottom edge of the drawing area.
Labels are only placed at the end of the grid line. For horizontal grid lines the end is at the right edge of the drawing area. For vertical grid lines the end is at the top edge of the drawing area.
Grid labels are not drawn at either end of the grid lines.
Interval
The label interval determines the frequency of labels on the grid lines. Only those grid lines whose grid value is an integral multiple of the label interval will have labels. The default value of 1 ensures that all grid lines will have labels.
A label interval of 100 though will ensure that only grid lines whose value is an integral multiple of 100 will have labels drawn. With such a grid line interval you could therefore have a map with grid lines at values of 100, 125, 150, 175 and 200 but only have labels drawn on the 100 and 200 grid lines.
Horizontal offset, Vertical offset
The horizontal and vertical offsets determine the placement of the grid line label with respect to the edge of the drawing area and the grid line. The diagram below shows the relationship of the grid line label, the grid line and the drawing area extent with the horizontal and vertical offsets.
|
|
1. horizontal offset 2. vertical offset 3. grid line |
The horizontal offset is measured away (towards the interior of the drawing area) from the closest drawing area edge. The vertical offset is measured perpendicular to the grid line, above it for horizontal lines and to the left of it for vertical grid lines.
X and Y Text presentation properties
Number sign
Whether a sign is placed with the grid value is determined by the value entered in this field. You may choose from:
- normal
- explicit
- none
Normal number sign conventions are used. That is, a preceeding negative sign is used for negative numbers and no sign is used for positive numbers.
A preceeding sign is always used for both negative and positive numbers.
No number sign is used regardless of whether the number is negative of positive.
No. decimals
The number of decimal places that are used to format the grid line value is determined by the value entered here. You may choose from:
- -1
- 0
- 1
- 2
- 3
No decimal places and no decimal point either.
No decimal places are used but a decimal point is.
The number will be formatted with decimal place.
The number will be formatted with 2 decimal places.
The number will be formatted with 3 decimal places.
Prefix
The grid line label may have a some characters placed before the numeric value. An example of this might be, Easting = 2500. A single space is used to separate the prefix and the numeric grid line value. If you do not require a prefix then leave this field blank.
Suffix
The grid line label may have a some characters placed after the numeric value. An example of this might be, 2500 East. A single space is used to separate the suffix and the numeric grid line value. If you do not require a suffix then leave this field blank.
Priority
Each item, line, text, symbol, etc. that is drawn on a map has a priority that is used to determine how items that clash should be drawn, or omitted. The value entered here is the priority of the grid label only.
Font options
Name
Select the font name.
Bold
Check this box for bold text.
Italic
Check this box for text in italics.
Underline
Check this box for underlined text.
Height (cm)
This is the height, in centimetres, of the grid line labels that will be drawn on the map.
Note: There are some minor known issues with fonts and the plot previewer.
Complete the COPY GRID PROPERTIES form and choose Apply to present the new grid definition in a graphics viewport.
Delete grid
This function allows you to delete existing grid definitions from the list of known grids.
To run this function: In the Plot Sheet Setup window, choose Grids > Delete, or...
- With the Plot Sheet Setup window open, in the Function Chooser, type PLOT DELETE GRID, and press ENTER.
Fields on the Delete plotting grid form
Grid ID
Choose the name of the existing grid definition that you wish to delete.
Choose Apply to delete the plotting grid. If you make a mistake and delete the incorrect grid definition, you may choose EXIT to leave the Plotting Sheet Setup module without saving the changes that have been made.
If the grid deleted is presently displayed in a viewport, that viewport will be destroyed. The border and drawing displayed with the grid ARE NOT destroyed though and they can be displayed again if required.
Save grid
This function allows you to save changes that you have made to the plotting grid definitions. The grid definitions are saved in the SSI_PLOTTING:grids.ssi file.
To run this function: In the Plot Sheet Setup window, choose Grids > Save, or...