


Plot Borders
Generally a border is drawn some distance in from the edge of the plotting sheet to create a presentation quality map. When processing a map you may choose a border definition that will create such a presentation effect on the final map. The PLOT BORDERS function opens the Plot Sheet Setup window so you can work with borders or title blocks.
Function Name(s) :
As border definitions are defined in terms of distances in from each sheet boundary, it is only necessary to have a small number of border definitions. This is because a border definition can be used equally well on any size sheet, especially when the border defines an area almost equal to the size of the sheet (by only being inside the sheet extent by a few millimetres).
All borders are defined in the SSI_PLOTTING:borders.ssi file. The PLOT BORDERS function provides an interactive graphics viewing and editing environment to create, modify and delete border definitions. Each border that is created, or selected for modification is displayed in a graphics viewport. Changes may be made to the border definition either by viewing the border properties in a dialog form or by editing the border location using mouse interactions.
The border is outside the draw area. The following image is provided to show the relative positions of the border and the draw area. In the following image, the border is set to 'no border'.
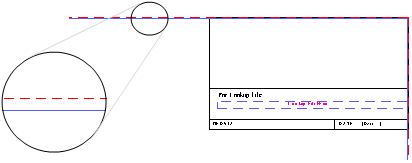
|
|
 = border
 = draw area
While working in this environment you may choose to display, create, modify and delete other sheet setup features such as drawing areas, grids and title blocks by choosing the menu for the appropriate feature.
Some menu commands relating to borders are as follows:
| Menu item | Description |
|---|---|
| Draw Areas | Displays the menu for managing drawing areas |
| Title Blocks | Displays the menu for managing title blocks |
| New | Allows you to create a new border definition |
| Select | Allows you to select an existing border and display the border in a new graphics viewport |
| Copy | Allows you to create a new border definition by copying an existing border and displaying it in a new viewport |
| Delete | Allows you to delete a border definition |
| Save | Allows you to save all border definitions to the SSI_PLOTTING:borders.ssi file |
| Properties | Allows you to display the properties of borders, drawing areas, grids or title blocks in a dialogue form for viewing or editing purposes |
| Move | Allows you to modify the border dimensions by using the mouse to select and drag any of the four border edges in or out from the sheet boundaries |
| Snap Grid | Allows you to display or modify the snap grid properties |
| Snap On | Displays a snap grid in the active viewport to aid in border definition |
| Snap Off | Erases a snap grid from the active viewport |
| Pan | Allows you to move the image of the border around by using the mouse to define the amount of displacement |
| Window In | Allows you to enlarge a portion of the displayed border by using the mouse to define the region of interest |
| Window Out | Undoes the effect of the most recent Window In operation |
| Zoom In | Allows you to enlarge the displayed part of the border by a factor of 2 |
| Zoom Out | Allows you to reduce the size of the displayed part of the border by a factor of 2 |
| Zoom All | Displays the entire border definition in the active viewport. |
| EXIT | Allows you to exit from the Plotting Sheet Setup module without saving any changes |
| EXIT & SAVE | Allows you to exit from the Plotting Sheet Setup module and ensures that any changes are saved. |
Helpful Hints
When using the Borders management functions for the first time you will find it easiest to select an existing border and examine its properties. You can then move the border extents to see how easy it is to modify a border definition.
New borders are easily created and can also be modified using the Properties or Move functions.
It is uncommon to have more than a few border definitions as the method of defining borders, in terms of distances in from the sheet extents, means that one border definition suits all sheet sizes. The border definition BORD shipped with all new systems is generally adequate for any use.
Select border
This function permits you to select an existing border definition and display it in a graphics viewport. After displaying the border in the viewport you may examine or alter its properties by using a form or you may move the border extents by using the mouse to select a border extent and drag it to a new location.
To run this function: In the Plot Sheet Setup window, choose Borders > Select, or...
- With the Plot Sheet Setup window open, in the Function Chooser, type PLOT SELECT BORDER, and press ENTER.
Fields on the Select plotting border form
Border ID
Choose the border that you wish to display in a graphics viewport, for example BORD or NOBO.
Result
The border that you have chosen is displayed in a graphics viewport. If the chosen border was already displayed in a graphics viewport, that viewport is made the active viewport.
New border
This function allows you to create a new border definition.
To run this function: In the Plot Sheet Setup window, choose Borders > New, or...
- With the Plot Sheet Setup window open, in the Function Chooser, type PLOT NEW BORDER, and press ENTER.
Fields on the New border properties form
Border ID
The name of the new border must be entered here. You may use any characters in the name excluding the comma (,) character. The border name must be unique as it is used later to select the border by name from the list of known borders.
Border names are case sensitive.
Border description
The border description is optional and is used to give a more verbose description of the purpose for which the border is used.
Preferred sheet
Although a border definition is suitable for any sheet size, to give a meaningful graphical presentation of the border you must give a preferred sheet size for the border so that it can be displayed.
Even though you may choose a particular sheet size here as the preferred sheet, this has no impact on the sheet size that this border may be drawn on when using the Process Map function.
Viewport dimensions from sheet boundaries (cm)
Left, Right, Bottom, Top
Borders are defined in terms of the distance in from each edge of the map sheet to each edge of the border. Distances of ZERO from each edge will ensure that the border is exactly the same size as the sheet.
On many plotters this is impractical as the feed rollers of the plotter prevent any drawing within a centimetre or two of the sheet boundary. You may need to adjust the viewport dimensions so that they are suitable for your plotter.
The plotting module will create the plotting instructions to draw a map to the extent of the plotting sheet and Plot Preview will correctly preview such plot files but the plotter may not be able to draw all the way to the sheet boundary.
These dimensions must be expressed in centimetre units.
Draw lines around the border
The viewport dimensions described define an area on the map sheet encompassed by the border. Generally this area has a line drawn around it to delineate the border. Enter Y to have these lines drawn. If you don't want lines drawn around the border extents enter N.
Title blocks are associated with borders by the Process Map function with the title block normally being drawn in a corner of the map sheet. This effect can be achieved by drawing a line around the border. By choosing to not draw lines around the border you can create maps where the title block is outside the drawing area and where there is no border surrounding the title block.
Pen number
Each line that is drawn on a map is drawn with a specified pen number. Each pen is associated with a colour through a pen file that can be easily modified to suit your requirements.
Line priority
Each item, line, text, symbol, etc. that is drawn on a map has a priority that is used to determine how items that clash should be drawn, or omitted. Since the border of the map should never clash with any other features of the map it is uncommon to use a priority other than the maximum of 125 for the priority of the border lines.
Complete the New border properties form and choose Apply to present the new border definition in a new graphics viewport.
Move
This function allows you to modify a border definition that is displayed in the active viewport by using the mouse with a click and drag action to adjust the locations of the border boundaries.
To run this function: In the Plot Sheet Setup window, choose Borders > Move, or...
- With the Plot Sheet Setup window open, in the Function Chooser, type PLOT MOVE BORDER, and press ENTER.
The following message is displayed.
Select and drag an item to a new location
Position the mouse near the edge of the border that you want to adjust and then, with the mouse button held down, drag the edge to the desired location and release the mouse button.
This function remains active until a new function is invoked by selecting it from the menu or until you press a key on the keyboard.
You may fine tune the changes that you have made to the border definition by selecting the border properties.
Copy border
This function permits you to create a new border by copying an existing border definition. You might choose to use this method if you wish to create a new border definition that is only slightly different to an existing border definition.
To run this function: In the Plot Sheet Setup window, choose Borders > Copy, or...
- With the Plot Sheet Setup window open, in the Function Chooser, type PLOT COPY BORDER, and press ENTER.
Fields on the Copy border properties form
Old Border ID
Choose the name of the existing border definition that you wish to copy when creating a new border definition. After choosing the existing border name and pressing the enter key, the properties of the exiting border are displayed in the appropriate fields.
New Border ID
The name of the new border must be entered here. You may use any characters in the name excluding the comma (,) character. The border name must be unique because it is used later to select the border by name from the list of known borders.
Border names are case sensitive.
Border description
The border description is optional. It states the purpose of the border.
Preferred sheet
Although a border definition is suitable for any sheet size, to give a meaningful graphical presentation of the border you must give a preferred sheet size for the border so that it can be displayed.
Although you can choose a particular sheet size here as the preferred sheet, this does not determine the sheet size that this border is drawn on when using the Process Map function.
Viewport dimensions from sheet boundaries (cm)
Left, Right, Bottom, Top
Borders are defined in terms of the distance in from each edge of the map sheet to each edge of the border. Distances of ZERO from each edge will ensure that the border is exactly the same size as the sheet.
On many plotters this is impractical as the feed rollers of the plotter prevent any drawing within a centimetre or two of the sheet boundary. You may need to adjust the viewport dimensions so that they are suitable for your plotter.
The plotting module will create the plotting instructions to draw a map to the extent of the plotting sheet and Plot Preview will correctly preview such plot files but the plotter may not be able to draw all the way to the sheet boundary.
These dimensions must be expressed in centimetre units.
Draw lines around border
The viewport dimensions described define an area on the map sheet encompassed by the border. Generally this area has a line drawn around it to delineate the border. Enter Y to have these lines drawn. If you don't want lines drawn around the border extents enter N.
Title blocks are associated with borders by the Process Map function with the title block normally being drawn in a corner of the map sheet. This effect can be achieved by drawing a line around the border. By choosing to not draw lines around the border you can create maps where the title block is outside the drawing area and where there is no border surrounding the title block.
Pen number
Each line that is drawn on a map is drawn with a specified pen number. Each pen is associated with a colour through a pen file that can be easily modified to suit your requirements.
Priority
Each item, line, text, symbol, etc. that is drawn on a map has a priority that is used to determine how items that clash should be drawn, or omitted. Since the border of the map should never clash with any other features of the map it is uncommon to use a priority other than the maximum of 125 for the priority of the border lines.
Complete the COPY BORDER PROPERTIES form and choose Apply to present the new border definition in a new graphics viewport.
Delete
This function allows you to delete existing border definitions from the list of known borders.
To run this function: In the Plot Sheet Setup window, choose Borders > Delete, or...
- With the Plot Sheet Setup window open, in the Function Chooser, type PLOT DELETE BORDER, and press ENTER.
Fields on the Delete plotting border form
Border ID
Choose the name of the existing border definition that you wish to delete, for example BORD or NOBO.
Choose Apply to delete the plotting border. If you make a mistake and deleted the incorrect border definition, you may choose EXIT to leave the Plotting Sheet Setup module without saving the changes that have been made.
If the border is displayed in a viewport, even if it is in a viewport that contains a drawing area, grid or title block, that viewport is destroyed. However, the drawing area, grid or title blocks ARE NOT destroyed and you can display them again by choosing a different border.
Save
This function allows you to save changes that you have made to the plotting border definitions. The border definitions are saved in the SSI_PLOTTING:borders.ssi file.
To run this function: In the Plot Sheet Setup window, choose Borders > Save, or...