


Entity create
This function allows you to add entity definitions to the library. You will be prompted for an entity name. The name entered must be different from the existing entity names.
To run this function: Choose Plotting > Entity > New, or...
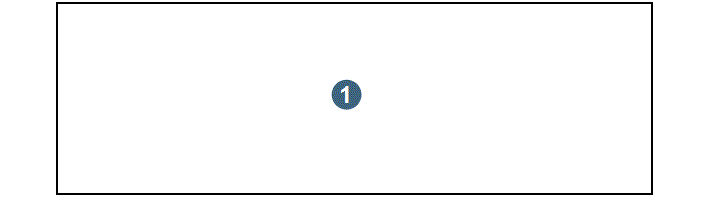
A plot sheet is interpreted as shown below. All references to angles, directions and reference points that follow for entities and user.chr are relative to this orientation for a plot sheet. For example, if you rotate your plot the title block is still defined in terms of the orientation below.
| Upper Left | Upper Right |
1. Plotting sheet 2. view from here |
|
|
|||
| Lower Left |

|
Lower Right | |
Entity Types
A map may be composed of the following types of entity.
- string entities, which are physical features represented as strings and always stored in `.str' files,
- image entities, which appear on top of the physical features, or behind them like a watermark.
- table entities, which are cells from a spreadsheet.
- note entities, which describe the positioning of a text file printout onto a map. Such textual data are always stored in a `.not' file.
Defining String Entities
A string entity defines the presentation attributes for string data stored in string files. It is composed of six possible attribute types:
- A string attribute is defined as a function that occurs at one location on a string.
- A line attribute joins all points in a string.
- A point attribute defines a function that occurs at each point on a string.
- A pattern fill attribute defines a function which creates a pattern to hatch the interior of closed segments of a string.
- A cliff attribute permits you to define how line segments will be placed on the map between strings which represent the crest and toes of cliffs.
- A colour fill attribute defines how to fill the area inside strings and segments with solid colours. This is generally only suitable for inkjet plot devices.
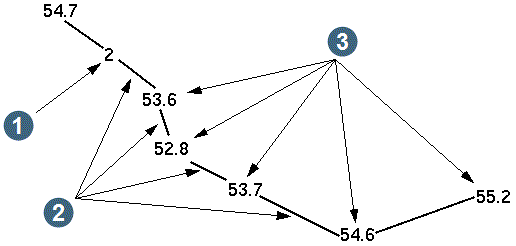
An entity definition can contain any or all of these attribute types. For example, a surveyor may plot a string that has been surveyed to show:
- the string number between the first two points on the string,
- the elevation of each point in the string at the point, with the decimal point defining the coordinates, and
- connect data points with a solid line, broken only to avoid overwriting text.
The plotted string would have the following style:
|
1. String operation (occurs at one location) 2. Line attributes (join points) 3. Point operation (occurs at each point) |
From the Plotting menu, select Entity, then New to invoke the function.
Name of new Entity
Enter the name of the entity which you wish to create. This entity must not exist in the plotting library.
Entity type
Enter the type of entity which is to be created.
- note - to indicate a note entity suitable for plotting text files on maps
- string - to indicate a string entity suitable for plotting string data on maps
- image - to indicate a .jpg, .jpeg, .tif, .bmp, .gif, or .png image
- table - to indicate an entity of cells from a spreadsheet
Complete the CREATE A NEW ENTITY form and choose Apply to display the DEFINE STRING ENTITY form if creating a ''string'' entity or the DEFINE NOTE ENTITY ATTRIBUTES if creating a ''note'' entity.
All parts of a string entity may be defined on a single data entry form. This form contains a number of scrolling regions which permit you to view and modify the various parts of the entity definition. To navigate your way around the form use the mouse and the scrollbars to make the required part of the DEFINE A STRING ENTITY form visible for editing.
ENTITY String Attributes
Use String operations
If you wish to define one or more string operations for this entity then enter `Y' in this field otherwise enter `N'. When you enter `Y' and press return the input fields for the string operations are displayed.
String Operations
You may define up to a maximum of nine different string operations in each entity. Some examples of string operations are:
- plotting the string number at the start of the string
- plotting the string Z value at regular intervals along the string (for contour labels)
- plotting a string value in the centre of the string (for example area from a D field)
For each string operation there may be up to 17 different parameters which you may have to define so that the data to be plotted, the location relative to the string, the pen number and priority are adequately defined.
This particular step may appear to be tedious, but is necessary in order to provide you the flexibility to create maps to suit your requirements.
Attribute Type
This defines the type of operation, that is the type of data to be plotted, to be performed for a string.
| Attribute Type | Description |
|---|---|
| symbol | Plot a centered symbol. These symbols are user definable. A list of the available symbols (from the SSI_PLOTTING: directory) may be displayed by choosing the browser attached to the Symbol input field. |
| note | Plot a notation which may contain up to a maximum of 14 characters. |
| field | Plot a value from a string file data field. The complete list of fields available for plotting is described below. |
| note+field | Plot a notation followed by a value from a string file field. For example, 'ELEV=54.2'. |
| sym in field | Plot a value from a string file field but position the value such that its decimal point is located at the specified coordinates. It is also possible to plot a '+', '*', 'x', as well as '.' at the specified coordinates. Note that the placement may not be exact but will typically be within 1/4 of the character width for HPGL/HPGL2 plotters using the default stick font although the error may be greater for other types of plotters. Plot Preview only attempts to get the position and size of text close to what would be seen on a hardcopy plot and so the errors will be greater when using Plot Preview to review a plot than would appear on the final hardcopy plot. |
| (field) | Plot a value from a string file enclosed in parentheses. |
String File Field
If the Attribute Type is either field, note+field, sym in field or (field) then you must define the string file field from which the data is to be obtained for plotting.
| String File Field | Description |
|---|---|
| STR | The string number. |
| STRSEG | The string number and segment number in the format SSS.sss where SSS represents the string number and sss represents the segment number. |
| LOC | The location of the string file. |
| ID | The ID number of the string file. |
| Y | The Y value of the point being plotted. |
| X | The X value of the point being plotted. |
| Z | The Z value of the point being plotted. |
| DESC | The first 32 characters of the point description field of the point being plotted. |
| D1 ... D99 | The value from the specified D field of the point being plotted. |
# Decimals
The number of decimal places to be used if the data being plotted is numeric. This is only required if the Attribute Type is either field, note+field, sym in field or (field).
Notation
If the Attribute Type is note or note+field then you must enter the notation which is to be plotted.
Symbol
If the Attribute Type is symbol or sym in field then you must enter the name of the symbol which is to be plotted. The list of available symbols may be displayed by choosing the browser. These symbols are defined in a number of string (.str) files and can be found in the SSI_PLOTTING: directory.
The symbols are defined by digitising strings which represent the symbols. These strings must have coordinates which range in value between -0.5 and 0.5 in Y and -0.5 and 0.5 in X.
Each symbol string is saved to a string file with a name representative of the symbol e.g. cross.str, star.str etc. The standard symbols distributed with the software are located in the SSI_PLOTTING: directory. You may have as many strings and segments as required to define the symbol.
The standard symbols supplied are shown in the table below:
| Name | Presentation | Name | Presentation |
|---|---|---|---|
| bar |

|
square |

|
| circle |

|
star |

|
| cross |

|
tick |

|
| hourglass | triangle |

|
|
| octagon |

|
uparrow |

|
| plus |

|
vdash |

|
Position
The symbol, notation or field value, that is, the attribute to be plotted, may be plotted in 1 of 6 possible positions relative to the string. The positions at which plotting may be performed are:
| Position | Description |
|---|---|
| start | Plot the attribute at the start of the string. |
| b1-2 | Plot the attribute midway between the first and second point on the string. |
| last | Plot the attribute at the last point on the string. |
| centre | Plot the attribute at the centre of the string. |
| centroid | Plot the attribute in the centroid of the string. The centroid is at: X=(xmin+xmax)/2, Y=(ymin+ymax)/2. |
| frequency | For plotting an attribute at a defined frequency along the string. This is useful for plotting contour values at regular intervals along a string. The frequency of attributes is entered in the Dist. from Point field and is interpreted as being expressed in user units, e.g. metres. |
Direction
The data to be plotted may be required at a position `near' the actual point specified. You may nominate a direction from that point in which to move to plot the data. Valid entries are:
| Direction | Description |
|---|---|
| none | Position the attribute right at the point. |
| angle | You will specify a direction, as a bearing from the point, at which the attribute is to be plotted. This generates a new or nominal point. |
| forward | Forward from the selected point along the direction of the string. |
| backwards | Backwards from the selected point along the direction of the string. |
| centre | Plot the attribute at a direction from the point that is the average of directions of the 'entering' and 'leaving' line segments. |
Angle from Point
If the Direction entered is angle then you must enter an angle to define the direction in which to move to locate the point at which plotting is to occur. The diagram below shows how the angle entered here is used.
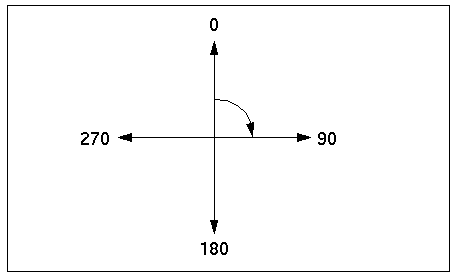
|
| plotting sheet |
Dist. from Point and Distance Type
If the Direction entered above was angle, forward, backward or centre, or if the Position was frequency then you must enter a distance here. A number of things influence how the distance is used to determine the location of the point for plotting.
The Distance Type also helps to determine the way in which the distance is used. Possible values for this are:
- actual, means the distance is expressed in millimetres so that if you enter `5', the attribute will be plotted 5 millimetres away on the plot sheet.
- percentage, means the distance is expressed as a percentage of the length of the line segment between 2 adjacent points on the string.
The Distance Type has no relevance when the Position being used is frequency.
The distance is used as described in the table below:
| Distance | Description |
|---|---|
| angle | The distance is only ever interpreted in terms of millimetres regardless of the entry for the Distance Type. |
| forward | The distance may either be in millimetres if the distance type is actual or a percentage of the length of the line segment to the next point in the string if the distance type is percentage. 50% is an easy way to plot attributes halfway between points. |
| backward | The distance may either be in millimetres if the distance type is actual or a percentage of the length of the line segment to the previous point in the string if the distance type is percentage. |
| centre | The distance may either be in millimetres if the distance type is actual or a percentage of the length of the line segment to the next point in the string if the distance type is percentage. |
| Position=frequency | The distance is assumed to be in real world or user units (i.e. metres). This permits attributes to be plotted at some defined interval along a string. |
Attribute text height
Enter the height in millimetres for the characters. An indirect way of defining the text height is to reference a string file description field by entering D1 or D2 etc. If you use a description field to define the text height then the text height for each text or symbol which is to be drawn is read from the specified string file description field. This makes it very easy to use the same entity but have it produce different size annotations depending upon the data being plotted.
Note:If the specified description field is either empty or does not contain a valid number which can be used for the text height then a text height of 1.8 mm will be used.
Attribute text angle
Enter the angle in degrees to define the plotting orientation for the characters. An indirect way of defining the text angle is to reference a string file description field by entering D1 or D2 etc. If you use a description field to define the text angle, then the text angle for each text or symbol which is to be drawn is read from the specified string file description field. This makes it very easy to use the same entity but have it produce differently orientated annotations depending upon the data being plotted.
Note:If the specified description field is either empty or does not contain a valid number which can be used for the text angle then a text angle of 0 will be used.
Text Angle Type
The angle defined above may be interpreted in one of three different ways by entering either:
- absolute, The angle is an absolute angle and is interpreted using the mathematical convention with respect to the plotting sheet.
- relative, The angle is interpreted as above except that the angle is relative to the direction of the string. Thus by using a relative angle of 90 it is easy to get annotations drawn at right angles to the string.
- bearing, The angle is a bearing, that is an angle measured clockwise from the reference direction, i.e. North. By using this method it is easy to align text and symbols with a particular direction such as the strike of a geological structure. This is especially useful when used in conjunction with the angle defined in a string file description field.
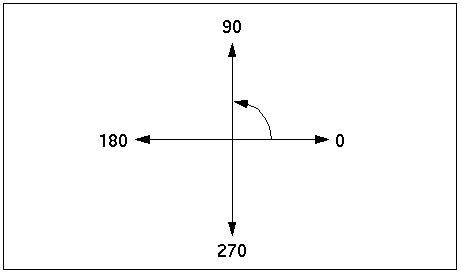
|
| plotting sheet |
Horiz Just
The above inputs define a nominal point at which to plot the attribute. Now, consider a rectangle which encloses the data to be plotted. Horizontally, it may be left, centre or right justified on the nominal point.
Valid entries for horizontal justification are:
- left, to align the left edge of the attribute with the nominal point, or
- centre, to have the attribute horizontally centred on the nominal point, or
- right, to align the right edge of the attribute with the nominal point.
Vert Just
Valid entries for vertical justification are:
- bottom, to align the bottom edge of the attribute with the nominal point, or
- centre, to have the attribute vertically centred on the nominal point, or
- top, to align the top edge of the attribute with the nominal point.
The data to be plotted may be aligned in the nominated position in nine possible ways. It may be left, centre or right justified horizontally, and bottom, centre or top justified vertically.
Priority
A priority system to provide you with control of overwriting on plots. Overwriting is controlled in two ways:
- lines may be made to `break' around text and symbols on a plot.
- where text or symbols may overwrite on a plot, some may be `clashed' off.
All lines and symbols (and text) in entity definitions are assigned priorities in the range 0 to 125. Different rules apply for priorities less than or equal to 100 and for those over 100.
The rules for breaking lines and clashing off symbols are listed below.
A line will break around a symbol if:
- its priority is less than the symbol,
- its priority is equal to the symbol and the priority is less than or equal to 100. A line will never clash a symbol off the plot, and all lines of any priority cross without effect.
A symbol will clash another symbol off the plot if:
- it has higher priority, or
- it has the same priority, less than or equal to 100, and is the first one processed in preparing the plot. Note that two symbols with the same priority greater than 100, will overwrite.
Pen number
Plotters may have a number of pens which you may specify to be different sizes or colours. This choice is made when the plotter is set up. At this stage the number of the pen is nominated. Later this pen number may be set up as biro, ink, of a certain size, or a certain colour.
Allow autoplot pen styles
- Selected. When you edit a map that uses this entity, in the Entity cell, you can enter a specific pen number to use as the colour for this entity (using the /PN<PenNumber> switch).
- Cleared. The string is plotted in the colour defined by the Pen number field for the entity.
ENTITY Point Attributes
If you wish to define one or more point operations for this entity then enter `Y' in this field otherwise enter `N'. When you enter `Y' and press return the input fields for the point operations will be displayed.
Most of the inputs required have been described in the definition of string attributes. There are two differences between the string and point attributes and these are:
- The Position in string input is not required for point attributes
- Offset from the line is required for point attributes
Use of forward and backward directions, and Percentage distances usually makes it necessary to be able to specify an Offset from the nominal point defined by those parameters.
For example, it is easy to specify the centre point of a line segment, but the attribute is usually required to be offset from that line. The value entered represents a perpendicular offset distance from such a line segment. A negative offset means an offset to the left of the line as the nominal point is approached from the data point at which the attribute is specified.
All remaining prompts used to define the point attributes are identical to those described for STRING ATTRIBUTES. See the section ENTITY String Attributes.
ENTITY Line Attributes
Line attributes permit you to define the type of line, if any, which is to be drawn between the points of a string. Use the scroll bars on the DEFINE A STRING ENTITY form to move to the part of the form where the line attributes are defined.
Use Line Operations
If you wish to have a line drawn between the points of a string enter `Y' otherwise enter `N'. If you enter `Y' to define the line attributes the input fields for the line attributes will become visible.
Line type
There are seven pre-defined line types which may be used. These line types are represented by a symbolic representation using dashes, dots and spaces. The lines produced by these pre-defined line types are shown below:
--------- (line type 1) A solid line
-- - -- (line type 2) Alternating long and short dashes
-- -- -- (line type 3) Short dashes
--- --- (line type 4) Long dashes
-- .. -- (line type 5) A dash, dot, dot, dash pattern
-- . -- (line type 6) A dash, dot, dash pattern
-- -- -- (line type 7) Short dashes with longer intervening spaces
Line styles other than the seven standard styles may be defined by entering \QSPECIAL'. You must define the pattern as described below.
Line priority
Each line has a priority in the range 0 through 125 inclusive.
Pen number
Nominate the number of the pen on the plotter to be used to draw these lines.
Pattern repeat length (mm)
The default pattern repeat length for patterned lines (standard or user-defined) is 25 mm. Changing this value here will cause the same pattern to be plotted but it can be compressed (repeat length < 25) or expanded (repeat length > 25).
# of segments in pattern
If you selected the SPECIAL line type then you must enter the number of segments which you wish to define in this special line pattern.
A line type consists of a repetition of a pattern, of alternate line and blank segments. You may specify a pattern of up to eight line and blank segments. You are requested for the `relative lengths' of each of the segments in the pattern. These are converted to actual distances, internally, based on the supplied pattern repeat length.
Example: Assume a line pattern consisting of two segments and nominated relative lengths for each of 100. Then if the pattern repeat length is nominated as 2 mm, this approximates a dotted line. If the pattern repeat length is nominated as 20 mm, then the line will be dashed with 10 mm dash length.
To add even greater variety to the possible line types, instead of nominating a relative length for any of the drawn line segments (i.e. Pen down), any character may be specified and it will form part of the line pattern as shown below.
Note:The embedded character must be entered enclosed in single quote marks.
| (Pen down) | |
|---|---|
| Segment 1 | 100 |
| Segment 3 | `/' |
The Special line type specification above produces a line pattern as shown below.

ENTITY Cliff Attributes
Cliff attributes permit you to define a relationship between crest and toe strings to permit the drawing of symbols (line segments) from crest strings to toe strings to enhance the maps and make it more obvious where steep cliffs or batters exist. Use the scroll bars on the DEFINE A STRING ENTITY form to move to the part of the form where the line attributes are defined.
The cliff attributes are defined relative to the `crest' string which is to be plotted. To be able to plot the cliff attribute some guidelines must be followed otherwise cliff symbols will not appear on the map. These guidelines are:
- Some consistency between the numbering of crest strings and toe strings must exist. Typically this is achieved by offsetting the toe string number from the corresponding crest string number by either 1 or -1. Therefore, if a toe string offset of 1 is used, and the crest string number is 10, then cliff symbols will be drawn from string 10 towards string 11.
- Matching crest and toe strings MUST have the same number of segments otherwise cliff symbols will not be drawn.
- Cliff symbols are drawn from segment 1 of the crest string to segment 1 of the toe string, and from segment 2 of the crest string to segment 2 of the toe string, etc. Therefore the same segment numbers of the crest and toe strings must correspond spatially otherwise spurious lines will be drawn all over the map. Generally it will be easiest if you restrict the crest and toe strings to having only one segment each.
- The crest and toe strings must travel in the same general direction otherwise meaningful results will be impossible.
- Corresponding crest and toe strings must not cross over otherwise meaningless results will be generated. This is because the side of the crest string on which the cliff symbols are to be drawn is determined once at the start of the crest segment.
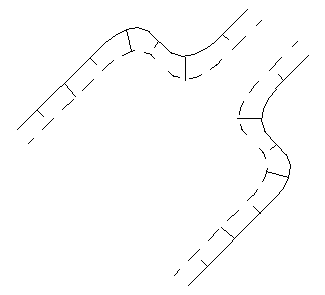
An example of the type of results which can be achieved with properly structured crest and toe strings is shown below.
Use Cliff Symbols
Enter `Y' if you wish to define cliff attributes as part of the entity otherwise enter `N'. If you enter `Y' the input fields for the various cliff parameters will become visible.
Toe offset
Enter the offset value so that toe string numbers can be determined from the crest string numbers. The crest strings which are to be processed are defined when the entity defining the cliff symbol attributes is included in a map definition.
Cliff symbol style
Four different styles of cliff symbols are available. These are:
- dashes
- full v
- half v
- wide dashes
- doublesmalldashes
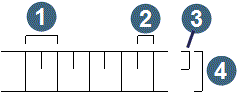
|
1. frequency 2. frequency2 3. Y/2 4. Y |
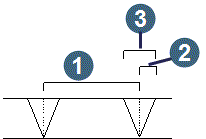
|
1. frequency 2. width/2 3. width |
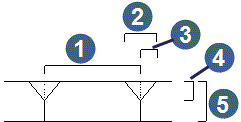
|
1. frequency 2. width 3. width/2 4. Y/2 5. Y |
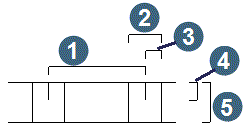
|
1. frequency 2. width 3. width/2 4. Y/2 5. Y |
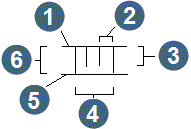
|
1. crest string 2. frequency/3 3. 2y/3 4. frequency 5. toe string 6. y |
Frequency
Enter the frequency, in real world units, between the line segments which are drawn from the crest string towards the toe string. The cliff symbols are drawn as line segments in the style chosen by the Cliff symbol style. The frequency is the real world distance along the crest string between cliff symbols as shown in the diagrams above.
Width
The diagrams above for the full v, half v and wide dashes show that a width parameter is required to define the location and spacing/size of the dashes. The value entered here is this extra width parameter.
Pen number
Enter the pen number which is to be used to draw the cliff symbol line segments.
Priority
As with all other features which are drawn on maps, the cliff symbols have a priority to assist with the clashing process while processing the map. Enter the priority for the cliff symbols.
ENTITY Pattern Fill Attributes
Entity fill attributes permit you to define how the interior of strings and segments are to be filled with hatch patterns. Use the scroll bars on the DEFINE A STRING ENTITY form to move to the part of the form where the pattern fill attributes are defined.
Use pattern fill
Enter Y if you wish to define fill attributes for the entity otherwise enter N. If you enter Y the input fields for the pattern fill attributes will become visible.
The fill pattern to be used may be defined by directly entering the name of a pattern or by using a lookup file (described below) and a value from the string file description field to indirectly define the name of the pattern to be used.
Pattern name
To define the pattern to be used directly, enter the name of the pattern here. Use the browser to obtain a list of the available patterns. The patterns are defined in the SSI_PLOTTING:patterns.ssi file.
Lookup file, Lookup field
If the Pattern Name is left blank then you must enter the name of the pattern lookup file and the string file field from which values are obtained to compare with entries in the lookup file.
This method is a convenient way of getting a variety of patterns by having the plotting module select the required pattern by matching the code stored in a specified D field. The EXTRACT SECTIONS FOR PLOTTING function creates string files suitable for using with the method of pattern selection.
The pattern lookup file is a text file which may be created with a text editor. There is also a Lookup File Editor which allows you to create and edit lookup files. An example lookup file is shown below.
default, ansi31, pen=3, scale=500
|
There are four comma delimited fields which need to be defined in the lookup file and they are:
| Field | Description |
|---|---|
| code value | This field is used to match with the value from the specified description field.
This is the first field in the record.
There is a special code here called default which will be used if the specific lookup code is not found in the lookup file. |
| pattern | This field is the name of the pattern which is to be used when a match is made with this code.
Pattern names are found in the SSI_PLOTTING:patterns.ssi file.
This is the second field in the record.
There is one special pattern name solid which will use colour fill to fill the object, rather than a pattern fill. There does not need to be a pattern called solid in your patterns file. In fact, if there is, it will be ignored. |
| pen number | This field is optional and only applies if the fill attribute in the entity definition has a pen number of 0 (zero). This is the third field in each record. It is an optional field. |
| pattern scale | This field is optional. If you specify a value here, then the pattern scale used when filling the object will be the one specified here. The pattern scale defined in the entity definition will only be used if you do not define a scale in this lookup file. |
Pattern Options
There are a variety of options available which determine how the pattern which has been selected will appear on the plot.
Hatching style
There are three possible hatching styles. The hatching style determines how the selected string will be hatched. The hatching styles possible are:
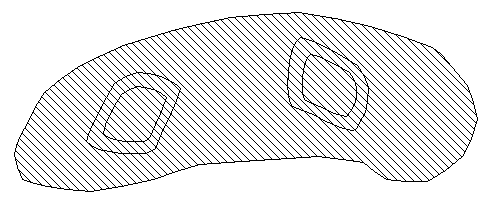
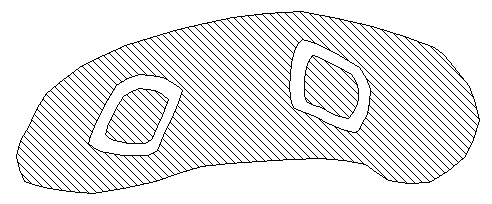
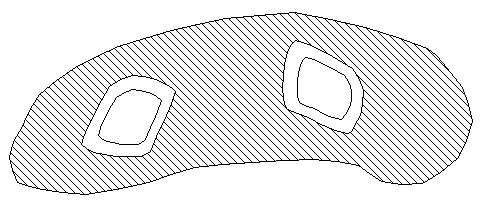
- normal - Normal hatching is used when you require "donut" effects in your hatching. This style implies that the pen is alternately lowered and raised as it crosses lines in the string or segment to which the hatching is being applied.
- outermost - Outermost hatching is used when you want only the outermost ring in a set of embedded closed segments of a string to be hatched.
- ignore - Ignore hatching is used when you want the entire string or segment to be hatched disregarding completely any crossings of the hatch pattern with any segments of the string between the extremities of the string or segment.
Apply to a
This options determines whether the same hatching pattern and style is to be applied equally to all segments in the string or whether the hatching pattern and style are to be applied individually to each segment of the string.
- string - to choose application to the string. In choosing this option all segments of the string will have the same hatching pattern. Normal hatching style combined with string hatching produces very interesting results. Ignore and Outermost hatching styles will generally produce undesirable results if the string has multiple segments which are not embedded within each other.
- segment - to choose application to each segment of the string. You will generally use this option in conjunction with a lookup file to produce different patterns for each segment based on the contents of a description field. In addition, application of the pattern to each segment will prevent the hatch pattern from `leaking' all over your plan especially if you are using the ignore option and the string segments are scattered all over the plan. A classic example of the use of segment application of patterns is when a string which consists of multiple closed segments represents different rock types (for example a symbolic geology string from the drill hole database). The rock types are represented by a code in the description field.
Pattern scale
The pattern scale can be used to alter the size at which the hatch pattern will be produced. The pattern is usually defined in units of centimetres although this is not necessarily the case. It is important that you use a scale value here which will scale the pattern definition units to the appropriate real world values when you take into consideration the scale at which the plan is to be plotted. The reason for this is because the hatch pattern is produced before you get the opportunity to specify the scale at which the map is to be drawn, hence the need to specify the pattern scale.
If you are producing a plot at a scale of 1:1000 then a Pattern scale of 1000 would be appropriate. You can however use any value you like to cause the pattern to be `looser' or `tighter' for different effects.
If the plan scale is 1:1000 then a pattern scale of 2000 will cause the pattern spacing to increase, while a pattern scale of 500 will cause the pattern spacing to decrease by a factor of 2.
Rotation angle
The rotation angle may be used to alter the orientation of the hatching scale. Valid entries range between 0 and 360. A value of zero will not alter the orientation of the pattern. Values other than 0 will result in a rotation of the pattern through the specified angle.
Pen number
The pen number indicates which pen on the plotting device is to be used for the pattern. If you are using a lookup file to define which pattern is to be drawn based on the contents of a string file description field, then you may define the pen number to be used in the lookup file. Note that the pen number from the lookup file will only be used if the pen number for the fill attributes is defined as ZERO. In addition if you use an entity modifier to change the pen number for the entity in the map definition then the pen number defined by the entity modifier will be used.
Priority
As with all other features which are drawn on a plan you may define the priority of the fill attribute to control how lines are to be removed when they clash with text and symbols on the map. Valid entries are 0 to 125 with 0 being the lowest priority and 125 being the highest priority.
Note:The clash detection is only performed between the individual line segments which comprise the pattern and symbols/text which is drawn on the map. Clash detection is not performed between hatching patterns.
Even strings and segments which are not closed can have hatch patterns drawn although the end result may not be desirable as the pattern will have a tendency to `leak' over your plan.
If you have a string completely contained inside another string, and they have different string numbers, hatching of the outermost string will produce a pattern inside the innermost string as well.
Be aware that the use of hatch patterns can increase substantially the number of line segments in a map and if clash detection is enabled then the time required to produce the plot will be substantially increased as there are many more line segments which must be included in the clash test.
The pattern (if a definition for it exists) is drawn over the area specified in the style and pen number defined by the entity definition. The end result is always predictable although it may not necessarily be what you require.
Depending on the relative priorities of the hatch patterns and text and symbols on the plan, the hatch pattern will be removed as necessary when it clashes with text and symbols.
Pattern xxx not found in file xxxError in definition of pattern xxx
Pattern for code xxx not found in lookup file xxx
This message will only appear if you are using a lookup file to define which pattern is to be used. The code value from the description field does not have a matching entry in the lookup file.
ENTITY Colour Fill Attributes
Colour Fill Attributes are useful for filling the area inside closed segments with a solid colour. This is particularly useful for creating presentation quality plots with areas of interest highlighted with distinctive colours. Use the scroll bars on the DEFINE A STRING ENTITY form to move to the part of the form where the colour fill attributes are defined.
Note:This Entity Attribute only produces a result for HPGL2 compatible devices, and even then it is most effective on devices which use ink-jet or bubble-jet technology. Although colour filling of polygons is possible on HPGL2 devices which use physical pens, the time taken and the limited reservoir of the pens sometimes makes this impractical.
It is possible to treat each segment individually so that regardless of the spatial arrangement of segments, the area inside each segment is filled with colour. Alternatively, it is possible to treat all segments of a string as a group to create dough-nut effects where segments are embedded inside other segments of the same string.
The colour which is used for filling the area inside the segments may be determined directly by entering a positive integer for the pen number, or indirectly, by using a lookup file, as with the Entity Fill Attributes pattern selection method, to enable the use of different colours for different segments of the same string.
Apply to
This entry determines whether the segments in each string to be plotted are to be treated individually, or if they are to treated as a group.
Valid entries and the effect produced are:
Each segment is treated individually, and using the Lookup File and Lookup Field, it is possible to produce a final plot which uses different colours for different segments.
All segments of a string are treated as a group. This is very useful if you wish to produce a plot which has the typical dough-nut effect where segments inside segments are treated as areas of exclusion.
Lookup file, Lookup field
Enter the name of the Lookup File which is to be used, in conjunction with the Lookup Field, to determine the pen number to colour the interior of the segments. If the Lookup File is not blank, the Pen number entered above has no significance in creating the plot. The format of the lookup file is described below.
If the Lookup file is non-blank then the value from the Lookup Field of the first point of the segment is used to find a matching code in the Lookup File, and hence, indirectly determine the pen number to be used.
Determine colour by (match or bounds)
The method which is used to determine the pen number may be either by performing a text comparison (match) or by performing a bounds check (bounds). Details of these two methods are described below and the different formats of the lookup file are described further below.
The lookup file contains a character value which must be matched exactly (the comparison test is case sensitive) and the pen number which is to be used when a match is found. This method is ideal when the value in the lookup field is a character code such as rock type.
The lookup file contains lower and upper limits to perform a bounds test and the pen number which is to be used when a match is found. This method is ideal when the value in the lookup field is numeric. This is useful for colouring inside segments by using grades which are stored in the description field.
Lookup File Format for `match' method
The lookup file may have any name although the preferred name is fill.lkp. The file is a text file with two fields on each line separated by a `,' (comma) character. The first field contains the text with which a match is to be made while the second field contains the pen number to be used.
The file may be as short or as long as required. The comparison which is performed between the value from the Lookup Field and the text in the Lookup File is a case sensitive comparison and so `a' does not match with `A'.
Lookup File Format for `bounds' method
The lookup file may have any name although the preferred name is bounds.lkp. The file is a text file with three fields on each line separated by a `,' comma character. The first field contains the low bound value, the second field contains the high bound value and the third field contains the pen number to be used.
The bounds check is performed by using >= low bound and < high bound. An example of a bounds format lookup file is shown below:
Pen number
Enter the number of the pen which is be used to colour the interior of the segments.
The Pen number is only used if you are NOT using a lookup file.
On HPGL2 devices the colour fill attributes will create colour fill inside segments as defined by the entity. No clash detection between the colour filled region and text or symbols is performed, thus it is possible to have text drawn inside a colour filled region.
On devices which do not support HPGL2 this attribute has no effect.
Note:It is important that any colour fill attributes are defined in the map before any other attributes otherwise text or lines which may be inside the colour filled region will not be visible due to the colour being flooded over the region inside the string.
Complete the DEFINE A STRING ENTITY form and choose Apply to save the entity definition to the plot library. This entity may now be used in a map definition for plotting.
Defining Note Entities
A defined note entity allows files of text data to be incorporated into a plot. Most modules that produce printed output place it in files in a format to facilitate its definition as a note. These files have a '.not' file type. To include such a note in a map you must define the size of text in the note, line spacing, whether a border is required around the text, etc. You may easily create your own note file by using a text editor to type the information into a file.
Complete the CREATE A NEW ENTITY form and choose `note' as the Entity Type and Apply to display the DEFINE NOTE ENTITY ATTRIBUTES form.
Note width (in characters)
Enter the length in characters of the maximum line you anticipate within the `.not' file (up to a maximum of 250 characters). If any line is longer than this it may be `clashed off' the map. Shorter lines are padded with spaces to this length.
Text height (mm)
Specify the character height (in mm) for data in the table.
Line height (mm)
The line height must be greater than or equal to, the chosen Text height. Lines of text are centred in lines of the height specified here; thus if the Line height equals text height each row of data will touch the top of the line below.
Enclose text in box
The whole table may be enclosed by a rectangular border drawn in the same pen as the rest of the note.
Plot lines separating rows
You may choose not to divide the table into rows. If you respond with Y for yes then a line will be drawn between each of the lines of text in the note. If you respond with N for no then no lines will be drawn between each of the rows of text.
Plot in which sheet corner
For the purpose of positioning a note on a plot, consider the note as a simple rectangle (which contains the note data). You must position this rectangle on the plot, inside the defined drawing area. This placement is defined by fixing one corner of the note rectangle on the plot, in relation to one of the corners of the plot drawing area, such that no part of the rectangle is outside that area.
The note may be located relative to any of the four corners of the drawing area; lower left (LL), upper left (UL), lower right (LR) or upper right (UR).
You should fix the corresponding corner of the note rectangle to the chosen drawing area corner. The following four prompts then completely specify the note position.
X offset from corner (mm)
Y offset from corner (mm)
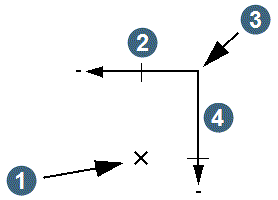
The offset distances specified here define a point relative to the sheet corner selected in the previous input. Offset distances are positive or negative depending on the direction of the offset from the nominated sheet corner. Directions right and up are positive; left and down are negative. To nominate a point 10 mm inside the right hand edge of the plot and 15 mm down from the top the three values entered would be:
|
Plot relative to upper right sheet corner X offset from corner: -10 Y offset from corner: -15 |
|
1. nominated point 2. 10mm 3. upper right sheet corner 4. 15 mm |
The note is then positioned on this point based on your responses to the following two prompts.
Horizontal justification
Vertical justification
The justification of the note rectangle on the point defined above must be specified such that the note will be inside the drawing area. To fix the upper right corner of the note to the defined point, the horizontal justification would be R (right) and the vertical justification would be T (top). Horizontal justification may be L, C or R (for Left, Centre, or Right) and vertical justification may be T, C or B (for Top, Centre, or Bottom).
Note:Variable length note files may be plotted using a single entity definition but the nominated note corner remains fixed in its defined position.
The horizontal and vertical justification definitions are:
- L, offsets are from the nominated sheet corner to the left edge of the note,
- C, offsets are from the nominated sheet corner to the centre of the note, or
- R, offsets are from the nominated sheet corner to the right edge of the note.
- T, offsets are from the nominated sheet corner to the top edge of the note,
- C, offsets are from the nominated sheet edge to the centre of the note, or
- B, offsets are from the nominated sheet edge to the bottom edge of the note.
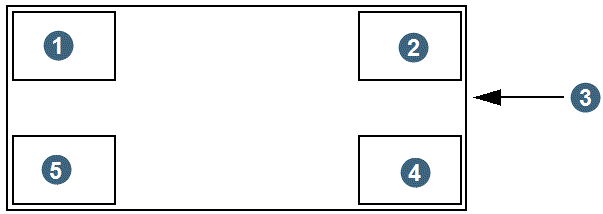
Below is a table which shows some standard ways of positioning a note entity on a map sheet.
The following diagram shows the different note positions.
|
1. position 3 2. position 4 3. map sheet 4. position 1 5. position 2 |
Angle of note (deg)
This entry specifies the angle (in degrees) at which the note is to be drawn. The entire note is rotated. It does not simply alter the slope of the text.
Priority
You can adjust the priority of the table to allow selective overwriting of its contents by string features. It is usual to assign a priority of 125.
Pen number
Nominate the number of the pen on the plotter to be used to draw this note. All the components of the note entity, both lines and text, will be drawn using this pen.