GuidoChart
Overview
A GuidoChart is an advanced widget that can be used to display a graphical chart on a form. As a chart is for the display of information this object is not a true widget as it does not accept input from the script user. There are a number of different charting techniques that can be used such as line, bar, pie, area, scatter, and even bubble charts. These are best seen by running the example code below. The GuidoChart will understand most of the switches that can be used for a GuidoPanel and has a number of special purpose switches described below.
Use of a GuidoChart requires knowledge of Guido action events and callbacks.
Synopsis
GuidoChart Name Body
Description
The GuidoChart command when processed will define a rectangular pane on the form upon which the specified chart will be drawn. The chart may contain a legend and other labels depending upon the switches you provide to it.
Arguments
Name Name is a unique identifier that you assign and is used to differentiate this object from other Guido objects in the form definition.
Body The body of the chart may contain a number of switches to specify the type of chart, labels, and the data to illustrate. The body begins with an opening curly brace and ends with a closing curly brace.
Switches Most switches that can be used on a GuidoPanel may be applied to the GuidoChart. See the reference for GuidoPanel for further information.
| -chartType type | The -chartType determines the type of chart to draw.
The type must be one of the types listed below
-chartType "Line" -chartType "Stacked Area" |
| -chartTitle label | The -chartTitle switch determines whether a title
is drawn above the chart graphic. You need to supply the text for the
chart title. No title is drawn unless you specify this switch.
-chartTitle "Depth v Samples" -chartTitle "Metres Drilled" |
| -legend true|false | The -legend switch is used to turn a chart legend
on or off. By default a chart legend is drawn
-legend true -legend false |
| -xAxisLabel label | The -xAxisLabel switch determines whether a label
is drawn underneath the X axis on the chart. You need to supply the label.
No axis labels are drawn unless you specify this switch.
-xAxisLabel "Time" -xAxisLabel "Samples" |
| -yAxisLabel label | The -yAxisLabel switch determines whether a label
is drawn next to the Y axis on the chart. You need to supply the label.
No axis labels are drawn unless you specify this switch.
-yAxisLabel "Depth" -yAxisLabel "volume" |
| $chartHandle setCategoryValue cat xVal yVal | The setCategoryValue is a Guido object method
and not a switch. This method can be invoked at form run time using the
handle to the chart object ($chartHandle) to set a category to
display on the chart along with an x axis and y axis value. Note that
it only sets one value per category. To set a number of values for the
category multiple object method calls must be made. See the examples below
for further information.
This method is used to set values for bar, line, and pie style charts. $chartHandle setCategoryValue "ABC" 1 20 $chartHandle setCategoryValue "ABC" 2 30 $chartHandle setCategoryValue "ABC" 3 5 |
| $chartHandle setXYValue cat xVal yVal | The setXYValue is a Guido object method and
not a switch. This method can be invoked at form run time using the handle
to the chart object ($chartHandle) to set a xy value to plot onto
chart. The category (cat) associates the value with a particular
set of values. Note that it only sets one chart value per category. To
set a number of values for the category multiple object method calls must
be made. See the examples below for further information.
This method is used to set values for scatter, polar, area, and line xy style charts. $chartHandle setXYValue "RL" 1 1600 $chartHandle setXYValue "RL" 2 1625 $chartHandle setXYValue "RL" 3 1650 |
| $chartHandle setXYZValue cat xVal yVal zVal | The setXYZValue is a Guido object method and
not a switch. This method can be invoked at form run time using the handle
to the chart object ($chartHandle) to set an xyz value to plot
onto chart. The category (cat) associates the value with a particular
set of values. Note that it only sets one chart value per category. To
set a number of values for the category multiple object method calls must
be made. See the examples below for further information.
This method is used to set values for bubble charts. $chartHandle setXYZValue "particle" 1 0.1 1.2 $chartHandle setXYZValue "particle" 2 0.1 0.6 $chartHandle setXYZValue "particle" 3 0.3 0.9 |
| $chartHandle setPieValue cat Val Val | The setPieValue is a Guido object method and
not a switch. This method can be invoked at form run time using the handle
to the chart object ($chartHandle) to set a category along with
its value on a pie chart. To set a value for each category multiple object
method calls must be made. See the examples below for further information.
This method is used to set values for pie style charts. $chartHandle setPieValue "Above" 20 $chartHandle setPieValue "Mean" 50 $chartHandle setPieValue "Below" 30 |
| $chartHandle clearChart | The clearChart is a Guido object method and
not a switch. This method can be invoked at form run time using the handle
to the chart object ($chartHandle) to clear the chart of its current
values.
$chartHandle clearChart |
| $chartHandle drawChart | The drawChart is a Guido object method and
not a switch. This method can be invoked at form run time using the handle
to the chart object ($chartHandle) to actually draw the chart.
See the examples below for further information.
$chartHandle drawChart |
Common Guido switches reference
Examples
Example 1
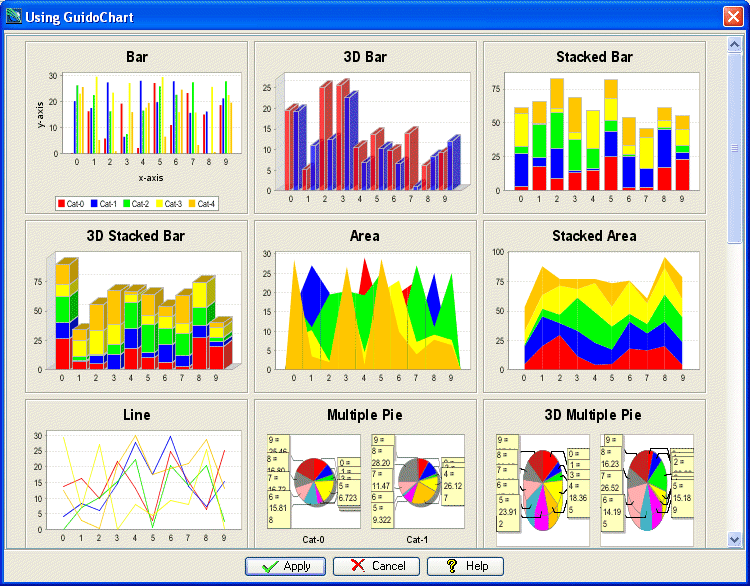
The example form below demonstrates all the available charting techniques. The data values are randomly generated. Note the use of a form procedure and the GuidoChart object methods for creating chart values and drawing the chart.
# GuidoChart Example 1
set formDef {
  # ----------------------------------------------------------------------
  # Form procedure to set the data in a chart. It takes the chart handle,
  # and sets the data using the method specified by "valType". "cats" is
  # the number of categories, "number" is the number of values per category
  # and "xlimit" and "ylimit" determine the range of the random values.
  # ----------------------------------------------------------------------
  proc setChart { cht valType cats number xlimit ylimit} {
    global attName
    global aValue
    global atts
    global target
    for {set j 0} {$j < $cats} {incr j} {
      set category "Cat-$j"
      for { set i 0} {$i < $number} {incr i} {
        set x [expr rand() * $xlimit]
        set y [expr rand() * $ylimit]
        set z [expr rand() * 5]
        if { $valType == 1 } {
          $cht setXYZValue $category $x $y $z
        } elseif { $valType == 2 } {
          $cht setCategoryValue $category $i $y
        } elseif { $valType == 3 } {
          $cht setPieValue "$category-$i" $x
        } elseif { $valType == 4 } {
          $cht setXYValue $category $x $y
        }
      }
    }
    $cht drawChart
  }
  GuidoForm testGuidoChart {
    -default_buttons
    -label "Using GuidoChart"
    -layout BoxLayout X_AXIS
    -help_id 334
    GuidoScrollPane pane {
      -height 30
      GuidoPanel rightPanel {
        -layout Flowlayout
        -width 65
        -height 75
        GuidoChart cht0 {
          -width 20
          -height 10
          -legend true
          -chartType "Bar"
          -chartTitle "Bar"
          -xAxisLabel "x-axis"
          -yAxisLabel "y-axis"
          -action initial {[setChart $cht0 2 5 10 20 30]}
        }

        GuidoChart cht1 {
          -width 20
          -height 10
          -legend false
          -chartType "3D Bar"
          -chartTitle "3D Bar"
          -action initial {[setChart $cht1 2 2 10 20 30]}
        }

        GuidoChart cht2 {
          -width 20
          -height 10
          -legend false
          -chartType "Stacked Bar"
          -chartTitle "Stacked Bar"
          -action initial {[setChart $cht2 2 5 10 20 30]}
        }

        GuidoChart cht3 {
          -width 20
          -height 10
          -legend false
          -chartType "3D Stacked Bar"
          -chartTitle "3D Stacked Bar"
          -action initial {[setChart $cht3 2 5 10 20 30]}
        }

        GuidoChart cht4 {
          -width 20
          -height 10
          -legend false
          -chartType "Area"
          -chartTitle "Area"
          -action initial {[setChart $cht4 2 5 10 20 30]}
        }

        GuidoChart cht5 {
          -width 20
          -height 10
          -legend false
          -chartType "Stacked Area"
          -chartTitle "Stacked Area"
          -action initial {[setChart $cht5 2 5 10 20 30]}
        }
        GuidoChart cht6 {
          -width 20
          -height 10
          -legend true
          -chartType "Line"
          -chartTitle "Line"
          -action initial {[setChart $cht6 2 5 10 20 30]}
        }

        GuidoChart cht7 {
          -width 20
          -height 10
          -legend true
          -chartType "Multiple Pie"
          -chartTitle "Multiple Pie"
          -action initial {[setChart $cht7 2 2 10 20 30]}
        }

        GuidoChart cht8 {
          -width 20
          -height 10
          -legend false
          -chartType "3D Multiple Pie"
          -chartTitle "3D Multiple Pie"
          -action initial {[setChart $cht8 2 2 10 20 30]}
        }

        GuidoChart cht9 {
          -width 20
          -height 10
          -legend false
          -chartType "Waterfall"
          -chartTitle "Waterfall"
          -action initial {[setChart $cht9 2 2 10 20 30]}
        }

        GuidoChart cht10 {
          -width 20
          -height 10
          -legend false
          -chartType "Area XY"
          -chartTitle "Area XY"
          -action initial {[setChart $cht10 4 5 10 20 30]}
        }

        GuidoChart cht11 {
          -width 20
          -height 10
          -legend false
          -chartType "Line XY"
          -chartTitle "Line XY"
          -action initial {[setChart $cht11 4 5 10 20 30]}
        }

        GuidoChart cht12 {
          -width 20
          -height 10
          -legend false
          -chartType "Polar"
          -chartTitle "Polar"
          -action initial {[setChart $cht12 4 3 10 360 20]}
        }

        GuidoChart cht13 {
          -width 20
          -height 10
          -legend false
          -chartType "Scatter"
          -chartTitle "Scatter"
          -action initial {[setChart $cht13 4 5 10 20 30]}
        }

        GuidoChart cht14 {
          -width 20
          -height 10
          -legend false
          -chartType "Time Series"
          -chartTitle "Time Series"
          -action initial {[setChart $cht14 4 5 10 100000 30]}
        }

        GuidoChart cht15 {
          -width 20
          -height 10
          -legend false
          -chartType "Step Area XY"
          -chartTitle "Step Area XY"
          -action initial {[setChart $cht15 4 3 10 20 30]}
        }

        GuidoChart cht16 {
          -width 20
          -height 10
          -legend false
          -chartType "Step XY"
          -chartTitle "Step XY"
          -action initial {[setChart $cht16 4 5 10 20 30]}
        }

        GuidoChart cht17 {
          -width 20
          -height 10
          -legend false
          -chartType "Pie"
          -chartTitle "Pie"
          -action initial {[setChart $cht17 3 1 10 20 30]}
        }

        GuidoChart cht18 {
          -width 20
          -height 10
          -legend false
          -chartType "3D Pie"
          -chartTitle "3D Pie"
          -action initial {[setChart $cht18 3 1 10 20 30]}
        }

        GuidoChart cht19 {
          -width 20
          -height 10
          -legend false
          -chartType "Bubble"
          -chartTitle "Bubble"
          -action initial {[setChart $cht19 1 5 30 20 30]}
        }

      }
    }
  }
}
# Create and run the form
SclCreateGuidoForm formHandle $formDef {}
$formHandle SclRun {}
if {"$_status" == "cancel"} {
  puts "Cancelling"
  return
}
|
Example 2
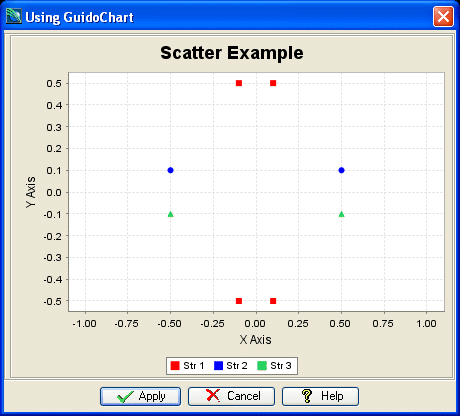
The example form below demonstrates using a GuidoChart in a more realistic example. In this example data is sent from the server Scl script up to the client Guido form via the use of an invisible GuidoField called inputData. This field is then interrogated by an initialisation form procedure which sets the values into the chart and then draws them.
The data values are read from a standard string file that resides in the SSI_PLOTTING: directory. You can easily adapt this example to use your own data.
# GuidoChart Example 2
set formDef {
  # A form procedure to plot values onto the scatter chart
  proc plotChart {chart dataHandle} {
    set data [split [$dataHandle getCurrentValue] ","]
    foreach {cat x y} $data {
      if {"$y" != ""} {
        # insert a value into the chart
        $chart setXYValue "Str $cat" $x $y
      }
    }
    # now display the chart
    $chart drawChart
  }
  GuidoForm guidoChart {
    -default_buttons
    -label "Using GuidoChart"
    -layout BoxLayout X_AXIS
    # a hidden field to contain the data values
    GuidoField inputData {
      -width 0
      -height 0
      -visible false
    }
    GuidoChart chart {
      -width 40
      -height 20
      -legend true
      -chartType "Scatter"
      -chartTitle "Scatter Example"
      -xAxisLabel "X Axis"
      -yAxisLabel "Y Axis"
      -action initial {[plotChart $chart $inputData]}
    }
  }
}
# load a string file and extract the str No, x, and y values for charting
set dataFile [open "SSI_PLOTTING:hash.str" "r"]
# skip the 2 header lines
gets $dataFile data
gets $dataFile data
# now read the data lines and append values to a variable called inputData
gets $dataFile data
while {![eof $dataFile]} {
  set comma1 [string first "," $data]
  set comma2 [string first "," $data [expr $comma1+1]]
  set comma3 [string first "," $data [expr $comma2+1]]
  set str [string trim [string range $data 0 [expr $comma1-1]]]
  set y [string trim [string range $data [expr $comma1+1] [expr $comma2-1]]]
  set x [string trim [string range $data [expr $comma2+1] [expr $comma3-1]]]
  if {$str != 0} {
    append inputData "$str,$x,$y,"
  }
  gets $dataFile data
}
close $dataFile
# Create and run the form
# Note that the value for the invisible form field inputData is set above!
SclCreateGuidoForm formHandle $formDef {}
$formHandle SclRun {}
if {"$_status" == "cancel"} {
  puts "Cancelling"
  return
}
|