Image entity attributes
You use this form to set the placement, size and colour intensity of an image that you want to appear in a plot.
To open this form Choose Plotting > Entity > New, type a name, select image, and click Apply.
Fields on the Define image entity attributes form
| Field |
Description |
| Entity name |
The name of the entity that you want to create, or which you are editing.
This entity must not already exist in the plotting library. |
| Plot in which sheet corner |
The corner of the drawing area of the plot where the image will appear.
- LL. Lower left.
- UL Upper left.
- LR. Lower right.
- UR. Upper right.
This setting works in conjunction with the Horizontal justification and Vertical justification settings to determine the placement of the image.
|
| X offset from corner (mm) |
The number of millimetres of space from the edge of the plot to the image. Offset distances are positive in the direction to the right, and negative in the direction to the left. |
| Y offset from corner (mm) |
The number of millimetres of space from the edge of the plot to the image in the vertical direction. Offset distances are positive in the direction up the sheet, and negative in the direction down the sheet. |
| Horizontal justification |
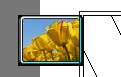
This setting works in conjunction with the Plot in which sheet corner and Vertical justification settings to determine the placement of the image. In the following images, the plot corner is UL, and the Vertical justification is T.
- L. The left edge of the image lines up with the plot corner.
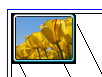
- C. The horizontal centre of the image lines up with the plot corner.

- R. The right edge of the image lines up with the plot corner.
|
| Vertical justification |
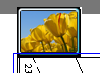
This setting works in conjunction with the Plot in which sheet corner and Horizontal justification settings to determine the placement of the image. In the following images, the plot corner is UL, and the Horizontal justification is L.
- T. The top edge of the image lines up with the plot corner.
- C. The centre of the image lines up with the plot corner.
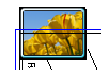
- B. The bottom edge of the image lines up with the plot corner.
|
| Size specification |
- physical dimensions. You set the size of the image in millimetres using X extent and Y extent.
- resolution. You set the size of the image in pixels per inch (PPI) using Resolution.
|
| X extent (mm) |
- <value>. The width of the image in the plot in millimetres.
- <blank>. The width of the image is the width of the drawing sheet.
- maintain aspect ratio. The width of the image is the width that is needed to maintain the aspect ratio of the image, given the Y extent.
|
| Y extent (mm) |
- <value>. The height of the image in the plot in millimetres.
- <blank>. the height of the image is the height of the drawing sheet.
- maintain aspect ratio. The height of the image is the height that is needed to maintain the aspect ratio of the image, given the X extent.
 Tip: To insert a background image that covers the entire drawing area, set X extent and Y extent to blank, clear the Foreground check box, and set Image Intensity to 25% or a different value less than 100%. Tip: To insert a background image that covers the entire drawing area, set X extent and Y extent to blank, clear the Foreground check box, and set Image Intensity to 25% or a different value less than 100%.
|
| Resolution (DPI) |
The pixels per inch (PPI) at which the image is displayed in the plot. A smaller Resolution creates a larger image in the plot. The minimum Resolution is 100. |
| Foreground |
- Selected. The image appears on top of the other data in the plot (but under the title block and the lines marking the edge of the drawing area or border).
- Cleared. The image appears under the other data in the plot.
|
| Image Intensity (%) |
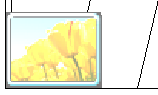
The intensity of the image colours. 100% is normal. 0% is a white image. A number less than 100% is useful when you want a background image, or any image that you want to be less prominent. The following image is displayed at 50% Image Intensity.
|
Output
The image entity is created with the settings you specified. When you create a map that maps the image entity to an image, and then process that map, the image is displayed in a plot.
See also


