


Table entity attributes
You can use this function to include cells from a spreadsheet in a plot. You use this function to set the positioning of the cells in the plot, and other formatting properties.
To include cells in a plot you must:
- Define a table entity attribute (using the ENTITY CREATE function).
- Create a map (using the MAP CREATE function) that specifies which spreadsheet to use and which data to display.
- Process the map, (using the PROCESS MAP function).
 Note: If you plot more than one range of cells, or the height or width of the range of cells is greater than the height or width of the page, the data is displayed in more than one tile on the plot. Settings such as Horizontal tile spacing determine the positioning of the tiles.
To run this function: Choose Plotting > Entity > New, and then choose Table or...
- In the Function Chooser, type ENTITY CREATE, press ENTER, and then choose Table.
Fields on the Define Table Entity Attributes form
| Field | Description |
|---|---|
| Entity name | The name of the entity that you want to create, or which you are editing. This entity must not already exist in the plotting library. |
| Spreadsheet properties | |
| Autosize box width |
|
| Box width | The width, in millimetres, of the box around the cells. |
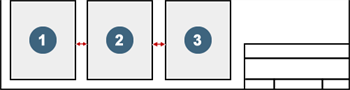
| Horizontal tile spacing |
The number of millimetres of horizontal space between tiles if the cells are displayed in more than one tile. |
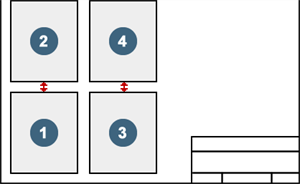
| Vertical tile spacing |
The number of millimetres of vertical space between tiles if the cells are displayed in more than one tile.
|
| Priority | A number between 0 (lowest priority) and 125 (highest priority) that determines whether string data can overwrite the cells. Typically, a table entity has a high priority. |
| Pen number |
The pen number determines the colour and line width in which to display the cells in the plot. Line width affects the width of lines but does not affect the size of numbers or text.
|
| Enclose text in a box |
Regardless of how Enclose text in a box is set, a border is always displayed around each cell in the plot. |
| Spreadsheet layout | |
| Plot in which sheet corner | The corner of the plot where the cells will appear.
|
| X offset from corner | The number of millimetres of space from the edge of the plot to the cells. Offset distances are positive in the direction to the right, and negative in the direction to the left. |
| Y offset from corner | The number of millimetres of space from the edge of the plot to the cells in the vertical direction. Offset distances are positive in the direction up the sheet, and negative in the direction down the sheet. |
| Horizontal justification | This setting determines the location of a corner of the box around the tiles in relation to the plot. After you select Plot in which sheet corner, the Horizontal justification is automatically set to an appropriate value. By changing the Horizontal justification, Vertical justification, and Enclose text in a box, you can move the cells to a location other than the four corners of the plot. |
| Vertical justification | This setting determines the location of a corner of the box around the tiles in relation to the plot. After you select Plot in which sheet corner, the Vertical justification is automatically set to an appropriate value. By changing Horizontal justification, Vertical justification, and Enclose text in a box, you can move the cells to a location other than the four corners of the plot. |
| Multiple range procession |
|
| Font options | |
| Use font styles from spreadsheet |
|
| Name | Name of the font to use when you are replacing the spreadsheet font options. |
| Bold | Whether or not to use bold formatting. |
| Italic | Whether or not to use italic formatting. |
| Underline | Whether or not to use underline formatting. |
| Text height | The font height in millimetres. |
 Tip: Run the PLOT EDIT PEN FILE function to see the colour and line width that is used for each pen number.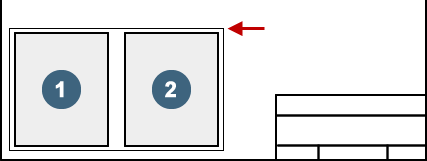
Output
The definition of the table entity is saved.