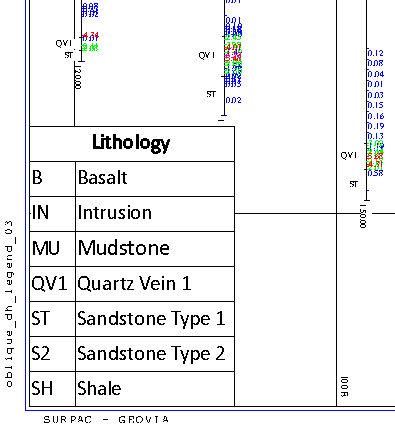
Creating a table showing a legend from a spreadsheet
Task: Creating a table showing a legend from a spreadsheet
You can create a 'table' entity that takes cells from a spreadsheet and adds them to a plot. You can use this feature to create a plot with a legend.
- Choose Plotting > Map > Copy.
- Fill in the Copy an existing map form as shown, and click Apply.
- Choose Plotting > Entity > New.
- Fill in the Create a new entity form as shown, and click Apply.
- Fill in the Define Table Entity Attributes form as shown, and click Apply.
- Start Excel.
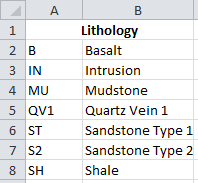
- Type the text for the legend into cells A1 to B8.
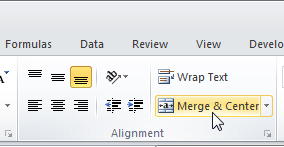
- Select cells A1 and B1, and then merge them and centre them.
- Apply bold formatting to the text Lithology.
- Save the Excel file as C:\Users\Public\GEOVIA\Surpac\<version>\demo_data\tutorials\plotting\legend.xlsx.
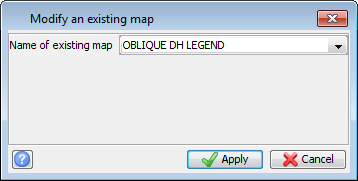
- Choose Plotting > Map > Edit.
- Select OBLIQUE DH LEGEND, and click Apply.
- In the Define a map form, right-click on the first column, and choose Add.
- Add a row for the LEGEND entity as shown.
- Click Apply.
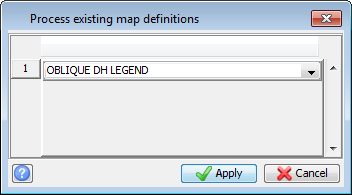
- Choose Plotting > Process > Map, select OBLIQUE DH LEGEND, and click Apply.
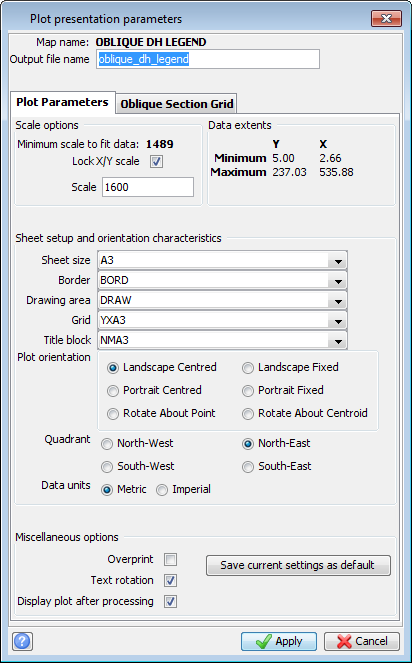
- Fill in the Plot presentation parameters form as shown, and click Apply.
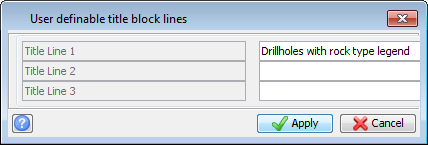
- Fill in the User definable title block lines form as shown, and click Apply.
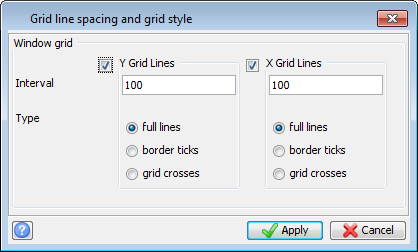
- In the Grid line spacing and grid style form, click Apply.
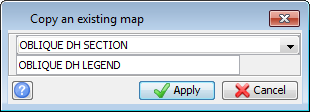
The OBLIQUE DH SECTION map is already set up to show some drillholes. In this task you will create a similar map that adds a legend to the plot.
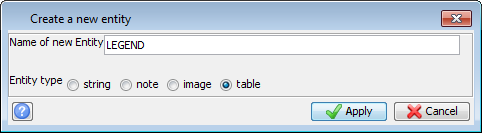
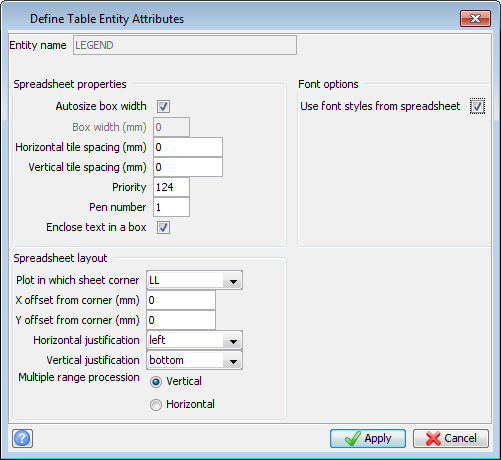
The Merge command is not in the same place in all versions of Excel. In Excel 2010, the Merge & Centre command is on the Alignment tab.
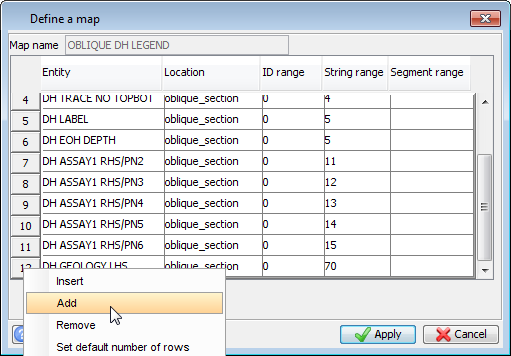
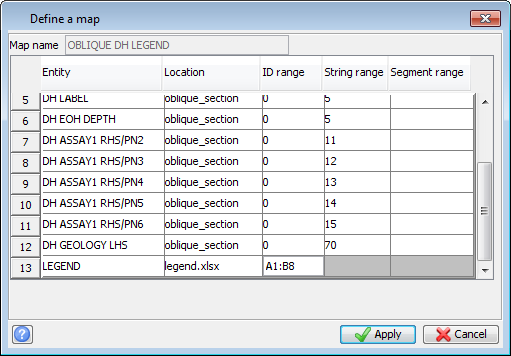
 Tip: If the cells are on a worksheet with a name other than Sheet1, you must enter <sheetName>
!A1:B8 in the ID range cell to successfully display the cells in the plot, for example litho!A1:B8.
A drillhole plot is created and displayed with a table showing a legend.