Other plotting tasks
Task: Copy cells from Excel to a plot
You can copy cells from Microsoft Excel ™ into a plot that is displayed in the Surpac Plotting window. In the plot, the cells appear as a table that you can move, group, ungroup, display, or hide. Formatting, including font type, font size, bold, underline, italics, horizontal and vertical alignment, is copied, but not bullet symbols or text colour.
 Tip: You can also copy and paste from a text editor such as Notepad, or from Microsoft Word ™, in which case formatting is not copied.
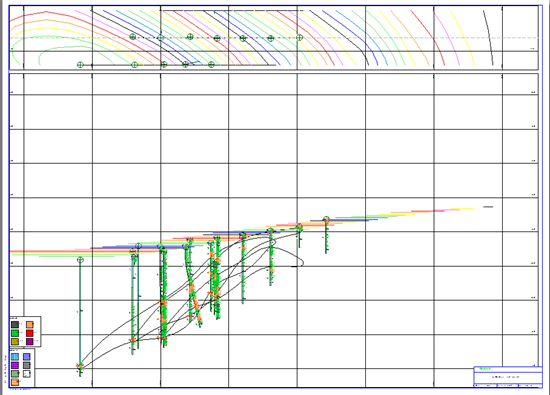
- Drag multi_solid_section_03.dwf into Graphics.
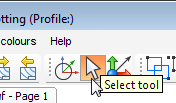
- On the Plot Tools toolbar, click the Select tool.
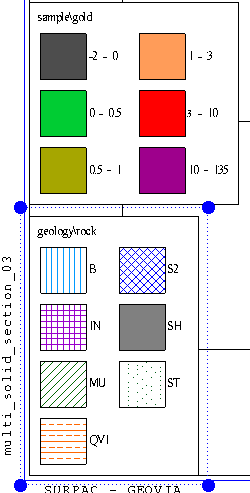
- Select the legend of rock types in the lower left corner, and press DELETE.
- Start Excel.
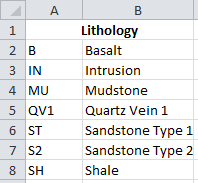
- Type the following text into some cells.
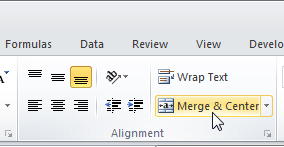
- Select cells A1 and B1, and then merge them and centre them.
- Apply bold formatting to the text Lithology.
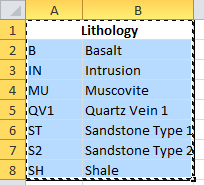
- Select cells A1 to B9, and press CTRL+C.
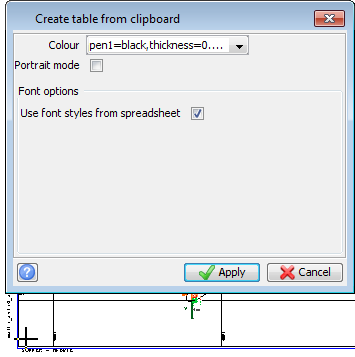
- In the Surpac Plotting window, choose Create > Table from Clipboard.
- Click in the lower left corner of the plot.
- Click Apply.
- Press ESC because you want only a single copy of this table.
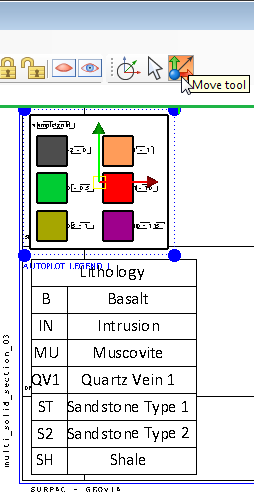
- Use the Select tool and the Move tool to move the grade and lithology legends so that they do not overlap.
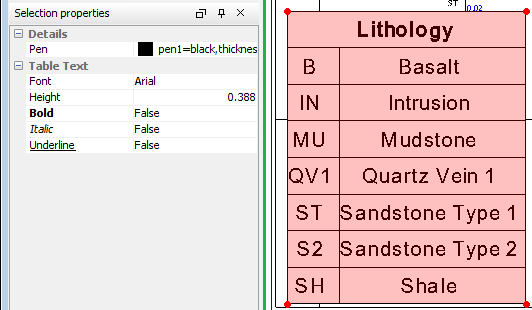
- Select the new table in the lower left.
- In the Properties pane, change the font to Arial.
- Choose Display/Hide > Tables.
- Choose Display/Hide > Tables to show the table again.
The Merge command is not in the same place in all versions of Excel. In Excel 2010, the Merge & Centre command is on the Alignment tab.
The Surpac Status bar displays a message to digitise the location for the second table.
The table is hidden.