


Section view map of drillhole data
Task: Create a section view map of drillhole data
- Choose Plotting > Process > Map.
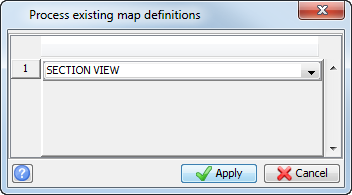
- Select SECTION VIEW, and click Apply.
- Enter the information as shown, and click Apply.
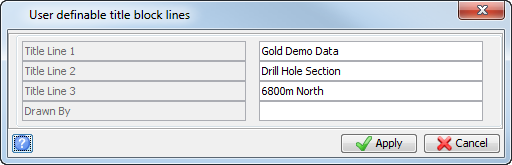
- Enter the information as shown, and click Apply.
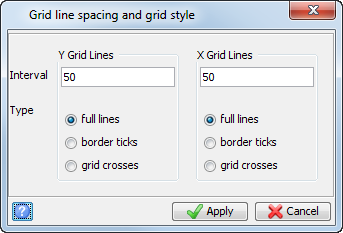
- Enter the information as shown, and click Apply.
- Close the Plotting window.
- Choose Plotting > Process > Last map.
- Enter the information as shown, and click Apply.
- Enter the information as shown, and click Apply.
- Enter the information as shown, and click Apply.
- Enter the information as shown, and click Apply.
- Zoom in to see the details in the drillhole data.
- Close the Plotting window.
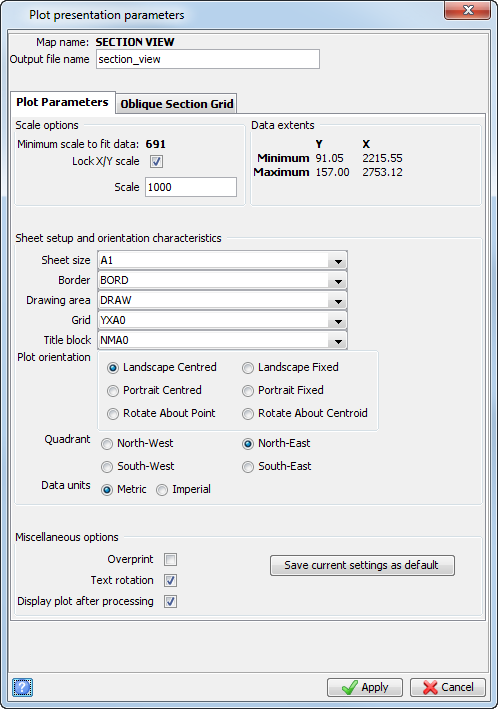
 Note: The ZXA0 grid is used for a section view, because it plots the label mRL on the grids ascending the page, and it plots Eastings on the grids going to the left of the page.
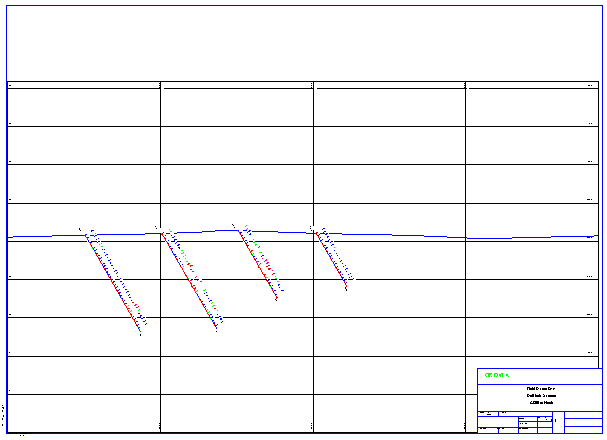
The plot is displayed.
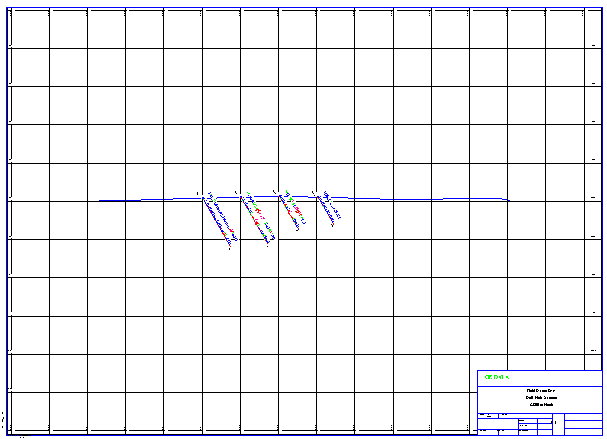
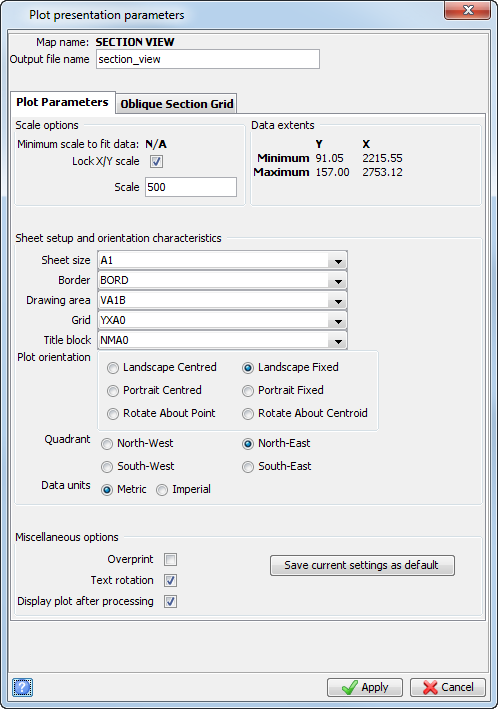
Note: The VA1B drawing area is a view used with an A1 sheet that plots at the bottom of the page. It encompasses about three quarters of the bottom area, but leaves a space at the top for a narrow plan view strip.
The Landscape Fixed orientation locks down the lower left-hand corner of the map. As you saw, when using the Landscape Centred orientation, the centre of the data is placed at the centre of the map. For plotting a series of section maps, this would work if all the data for all the sections had the exact same minimum and maximum data extents in elevation and easting (or northing). However, this is rarely the case, and it is also necessary to align the upper (plan view) drawing area with the lower (section view) data. Therefore you must establish a common easting value for the left edge of the drawing. The Landscape Fixed orientation usually used when plotting a section view with a plan view strip at the top.
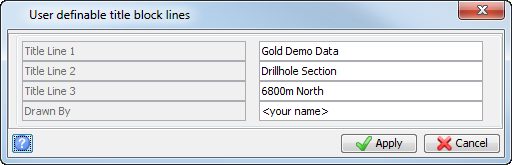
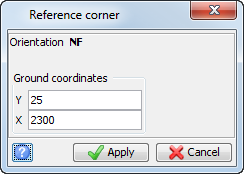
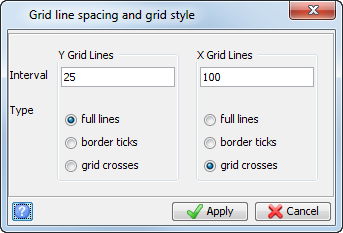
Note: The orientation is listed as NF. This is equivalent to Landscape Fixed. Because you are processing a section view map, "Y" on this form refers to elevation.
The plot is displayed.
Task: Create and plot an oblique section of drillhole data
- Click Reset Graphics
 .
. - Open oblique_section_line.swa in Graphics.
- Choose Display > Point > Attributes.
- Enter the information as shown, and click Apply.
- Choose Display > Point > Attributes.
- Enter the information as shown, and click Apply.
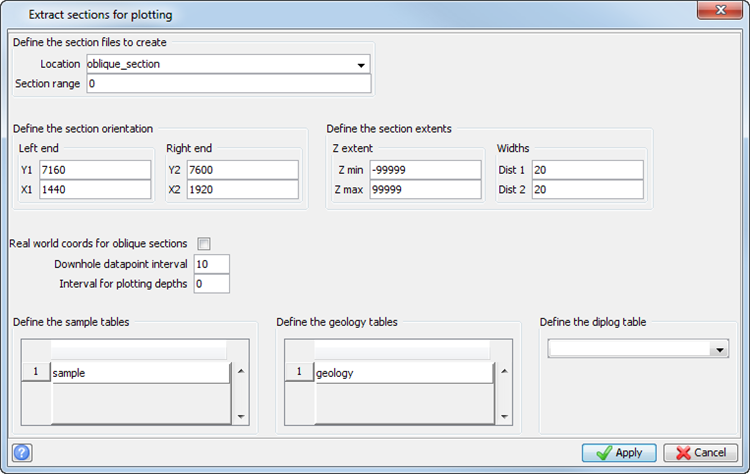
- Choose Database > Extract > Sections for plotting.
- Enter the information as shown, and click Apply.
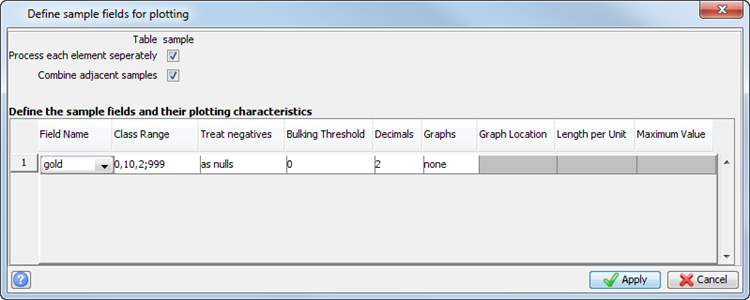
- Enter the information as shown, and click Apply.
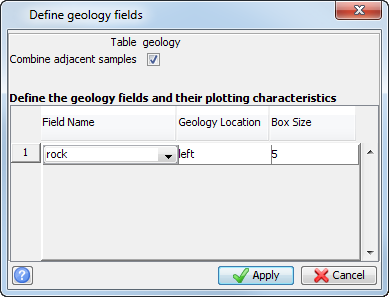
- Enter the information as shown, and click Apply.
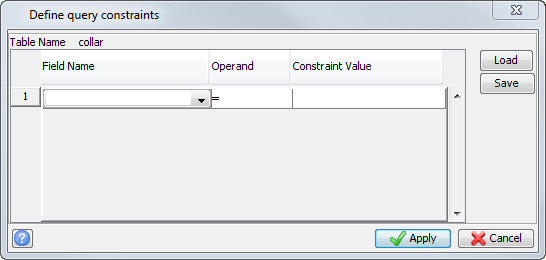
- Enter the information as shown, and click Apply.
- Click Reset Graphics.
- Open oblique_section0.str in Graphics.
- Choose Display > Strings > With string numbers.
- Enter the information as shown, and click Apply.
- Choose Inquire > Point properties.
- Select string 33 000.
- Press ESC.
- Choose Plotting > Map > Import.
- Enter the information as shown, and click Apply.
- Choose Plotting > Map > Edit.
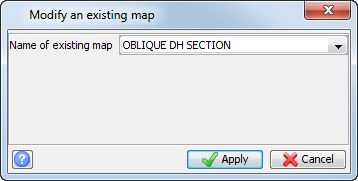
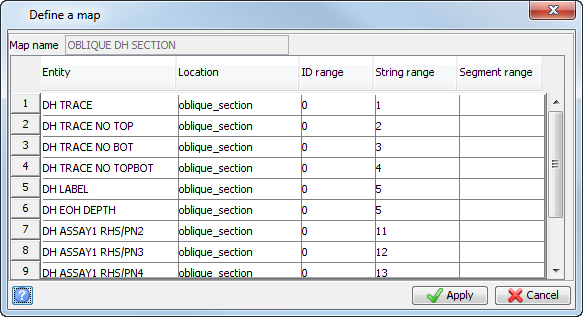
- Enter the information as shown, and click Apply.
- Click Apply.
- Choose Plotting > Process > Map.
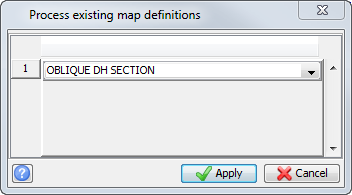
- Select the OBLIQUE_DH_SECTION map definition, and click Apply.
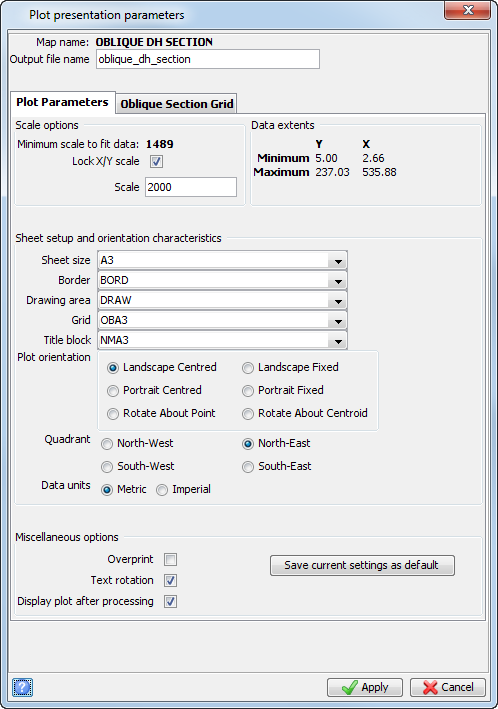
- On the Plot Parameters tab, enter the information as shown, and then select the Oblique Section Grid tab.
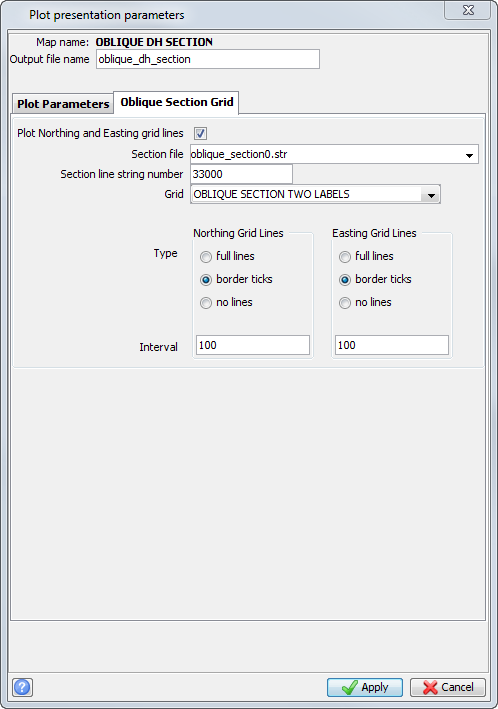
- On the Oblique Section Grid tab, enter the information as shown, and click Apply.
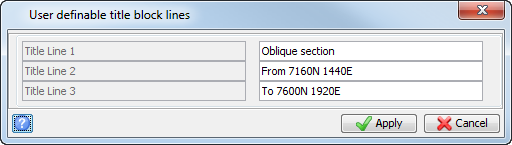
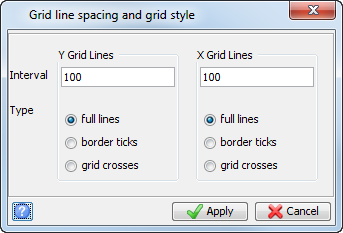
- Enter the information as shown, and click Apply.
- Enter the information as shown, and click Apply.
- Select View > Window in, or use the mouse scroll wheel to zoom in on one edge of the map as shown below.
- Close the Plotting window.
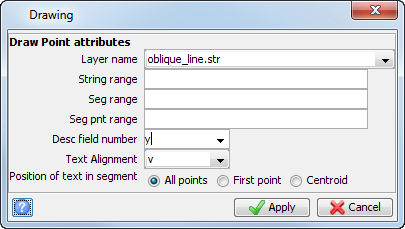
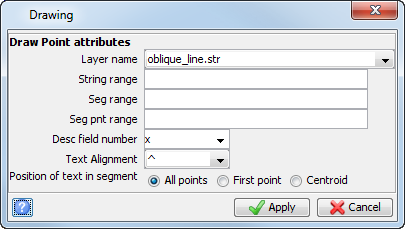
 `
`
The file oblique_section0.str is created in the working directory.
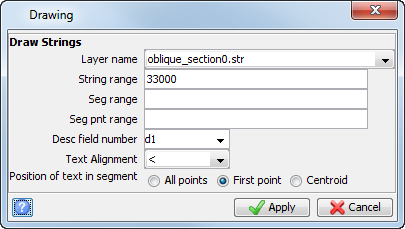
String 33 000 is displayed.
The point properties of string 33000 are displayed in the message window.
Note: String 33000 is only created when an oblique section is defined. It consists of a single point which contains the start and end coordinates of the oblique section in the description fields of this point.
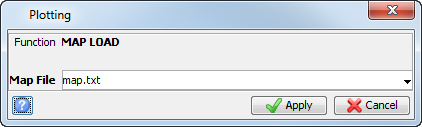
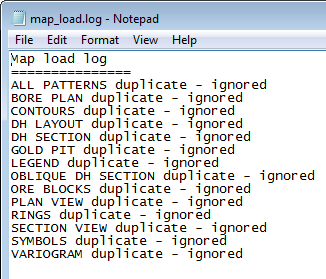
The map_load.log file is displayed.
Note: The fields of this tab only become active if the Grid selected on the Plot Parameters tab is blank, NOGR, or one of the oblique grids.
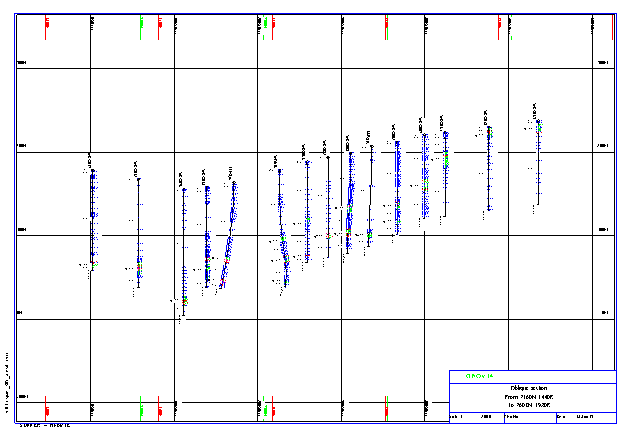
The Plotting window opens, and the .dwf file is displayed.
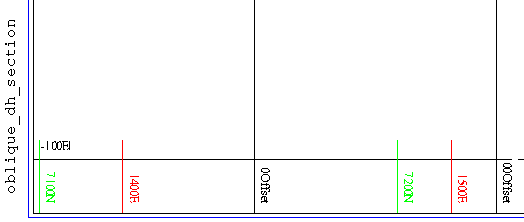
The real world Nothings and Eastings are displayed.