


Section plotting
Task: Create a simple section plot
- Click Reset graphics
 .
. - Open topo1.str in Graphics.
- Open ore_solid1.str in Graphics.
- Connect to surpac.ddb.
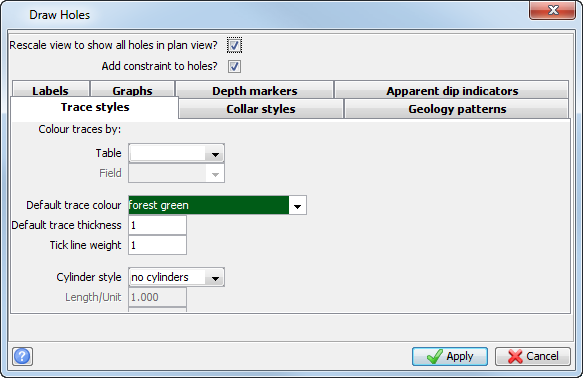
- Choose Database > Display > Drillholes.
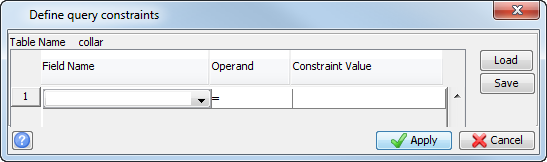
- Enter the information as shown, and click Apply.
- Enter the information as shown, and click Apply.
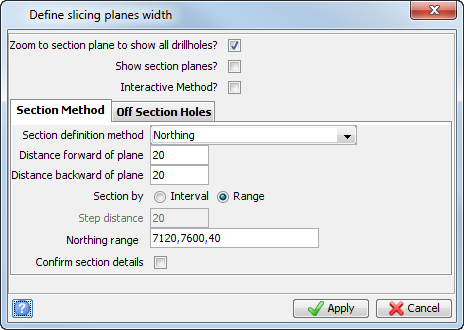
- Choose Database > Sections > Define.
- Enter the information as shown, and click Apply.
- Choose Database > Display > Drillholes.
- Enter the information as shown on the Geology patterns tab.
- Enter the information as shown on the Labels tab, and click Apply.
- Click Next section
 .
. - Click Next section until section 7320 is displayed.
- Click Autoplot
 .
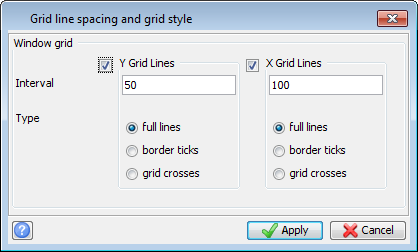
. - Enter the information as shown, and click Apply.
- Enter the information as shown, and click Apply.
- Press F1.
- Click and drag in Graphics to move the box as shown.
- Press F2.
- Enter the information as shown, and click Apply.
- Choose File > Close to close the Plot Preview window.
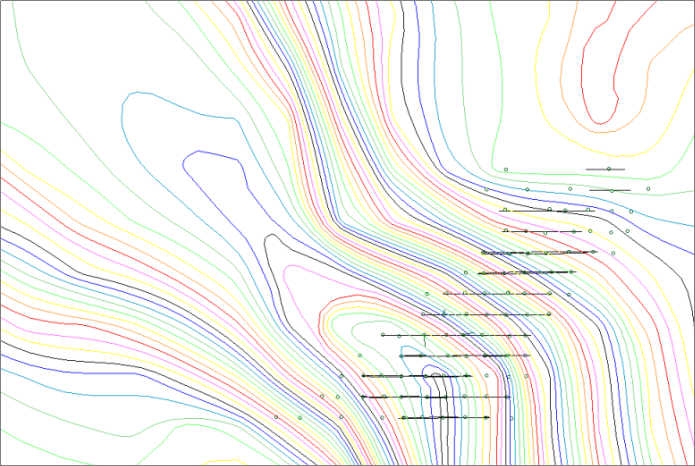
The data in the two string files and the drillhole traces is displayed.
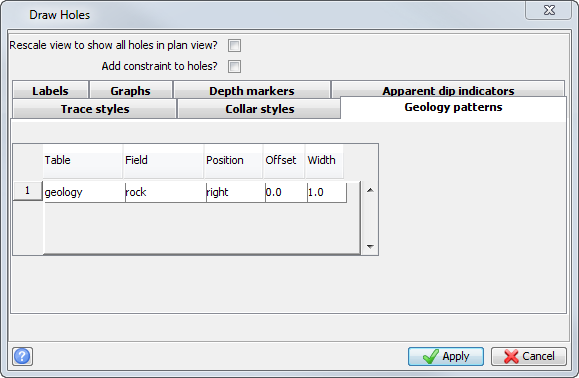
 Note: Right-click in the empty space below the first row, and select Add to add a second row to the table.
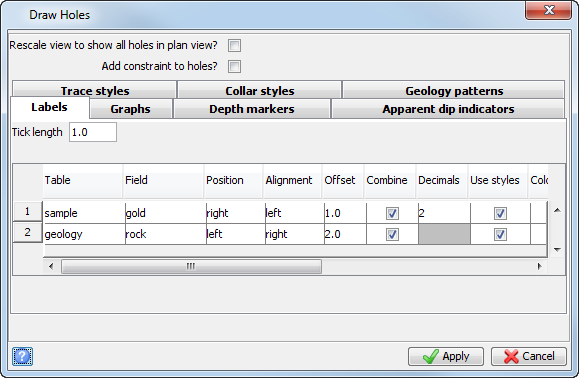
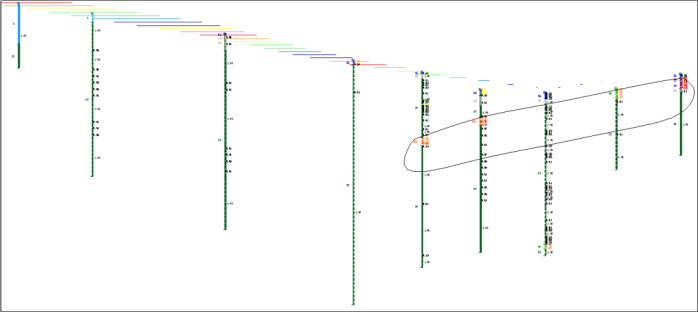
The data is displayed.
The section number is displayed in the Status bar  .
.
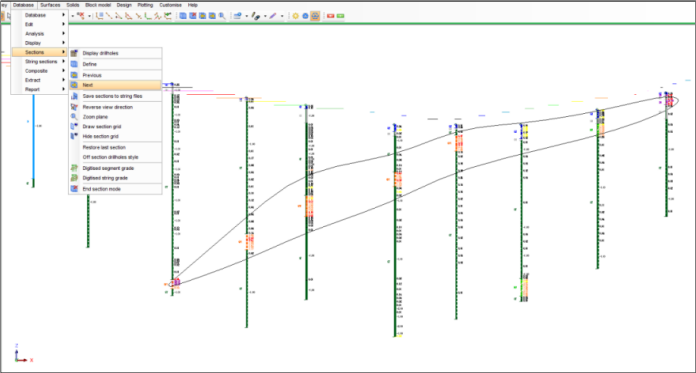
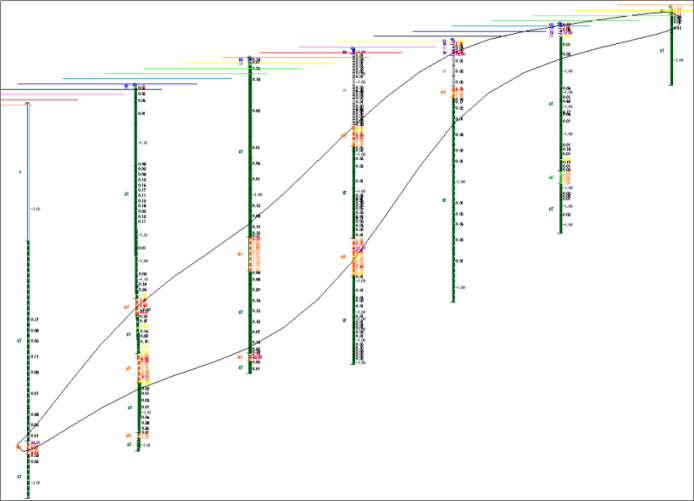
Note: If you have difficulty performing these steps, click Reset graphics, and then open section_7320_north.swa in Graphics.
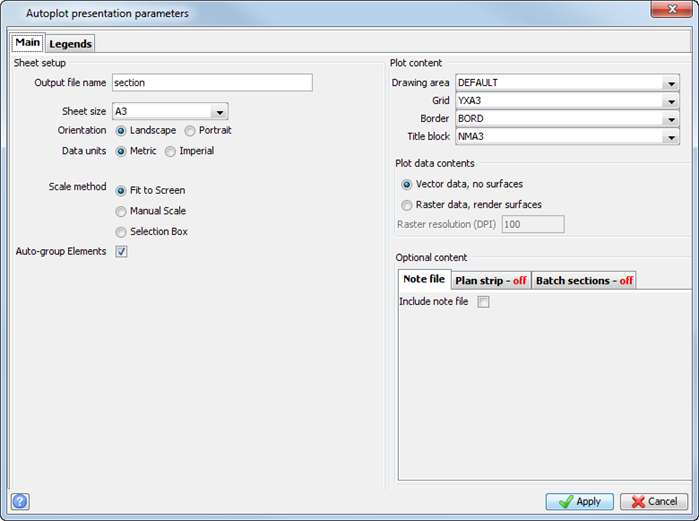
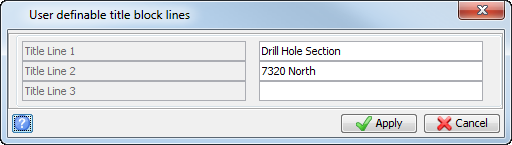
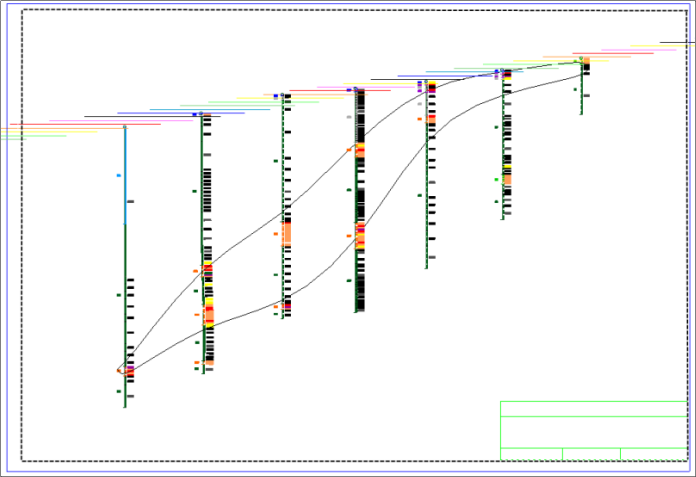
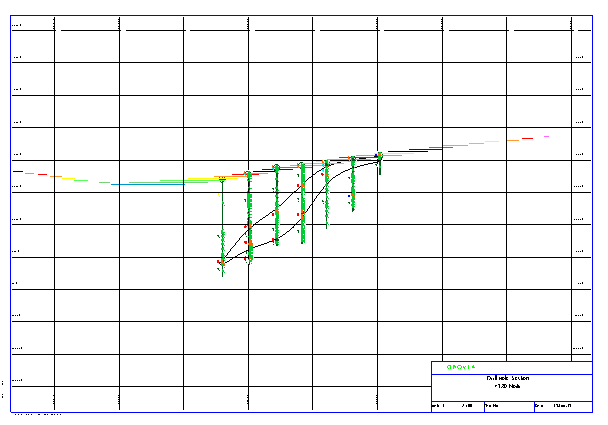
The file section.dwf is created and displayed in the Plot Preview window.
Note: To see all of the steps performed in this task, run _01b_autoplot_section.tcl. You need to click Apply on any forms presented.
Task: Create a section plot with a plan strip
- Click Reset graphics.
- Open section_7320_north.swa in Graphics.
- Click Autoplot.
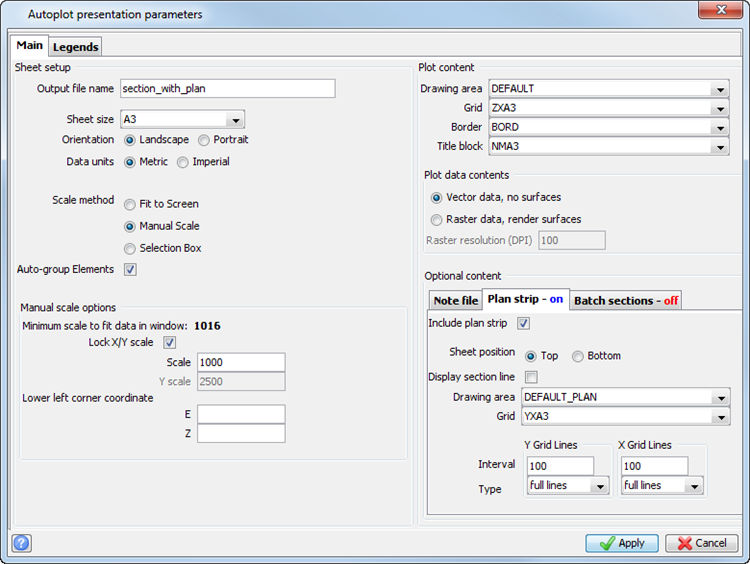
- Enter the information as shown, and click Apply.
- Enter the information as shown, and click Apply.
- Press F1.
- Click and drag in Graphics to move the box as shown.
- Press F2.
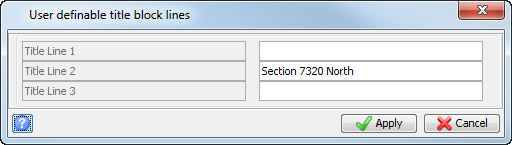
- Enter the information as shown, and click Apply.
- Choose File > Close.
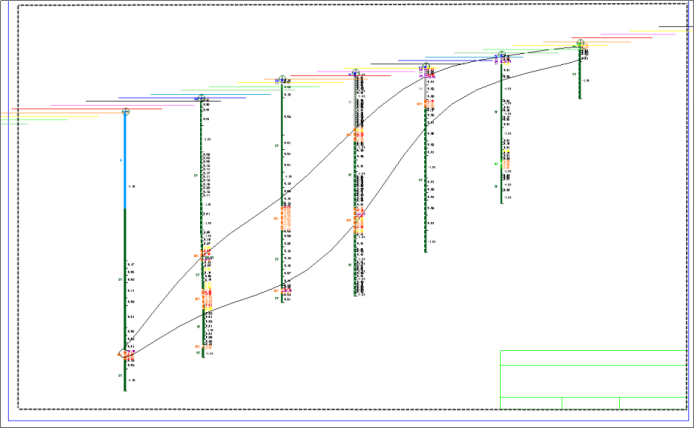
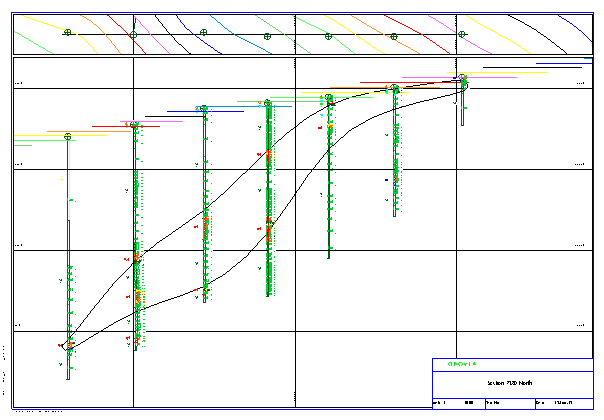
The file section_with_plan.dwf is created and displayed in the Plot Preview window.
Note: To see all of the steps performed in this task, run _01c_autoplot_section_plan_strip.tcl. You need to click Apply on any forms presented.
Task: Create multiple section plots
- Click Reset graphics.
- Open section_7320_north.swa in Graphics.
- Click Autoplot.
- Enter the information as shown.
- Click the Batch sections tab.
- Enter the information as shown, and click Apply.
- Enter the information as shown, and click Apply.
- Press F1.
- Click and drag in Graphics to move the box as shown.
- Press F2.
- Enter the information as shown, and click Apply.
- Open multi_section.dwf in Graphics.
- Open multi_section_01.dwf in Graphics.
- Open multi_section_02.dwf in Graphics.
- Open multi_section_03.dwf in Graphics.
- Choose File > Close to close the Plot Preview window.
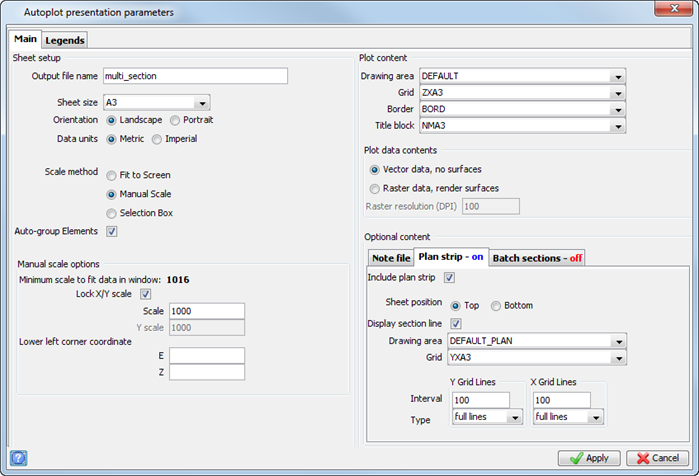
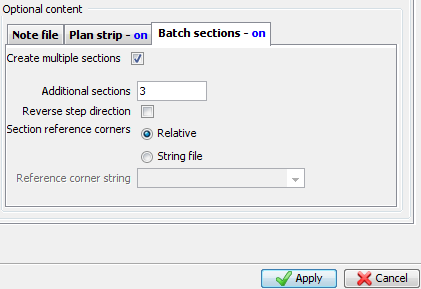
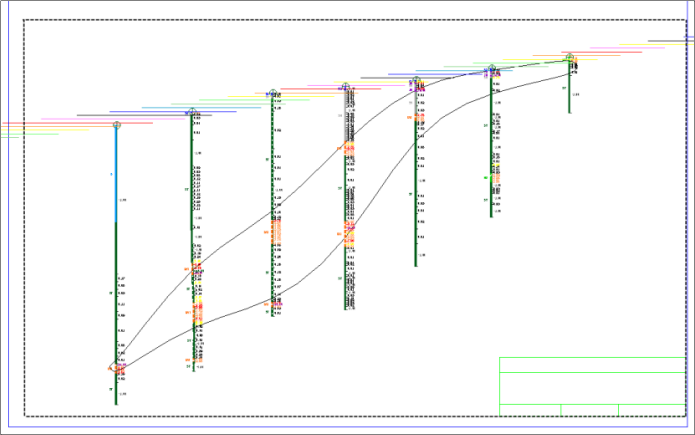
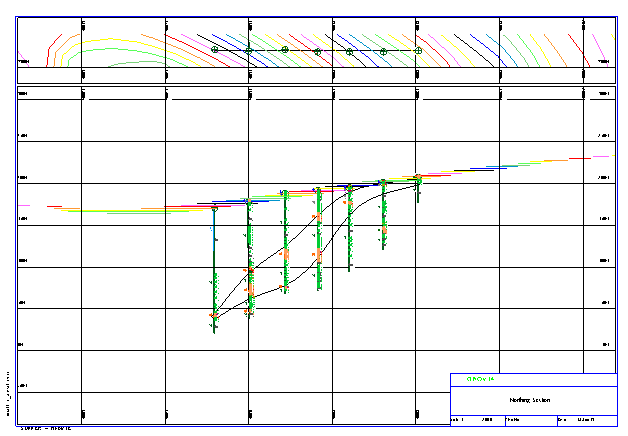
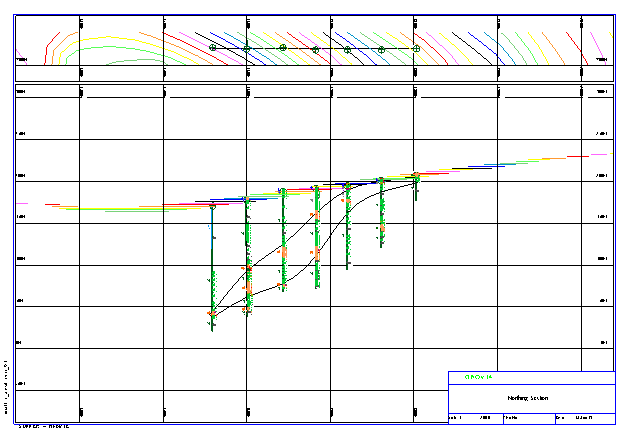
The following files are created:
|
Northing |
Filename |
|---|---|
|
7320 |
multi_section.dwf |
|
7360 |
multi_section_01.dwf |
|
7400 |
multi_section_02.dwf |
|
7440 |
multi_section_03.dwf |
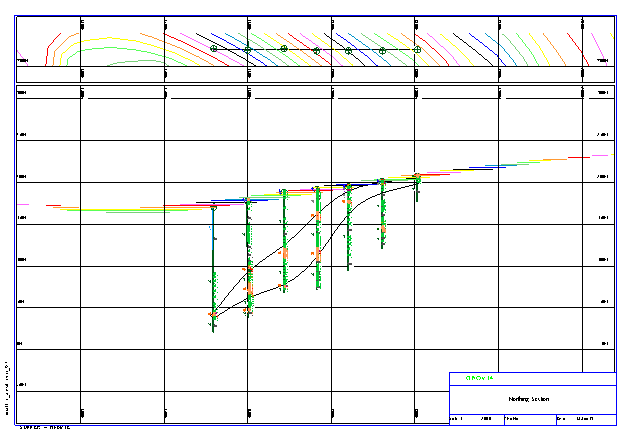
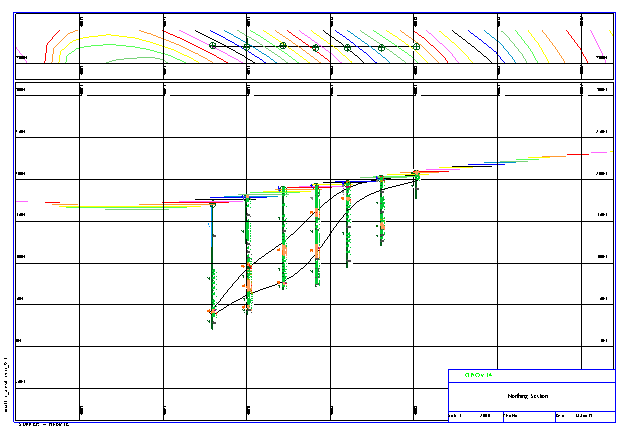
Note: To see all of the steps performed in this task, run _01d_autoplot_multiple_sections.tcl. You need to click Apply on any forms presented.
Task: Create a title block for multiple section plots
- Choose Plotting > Plotting Sheet setup window.
- Choose Title Blocks > Copy.
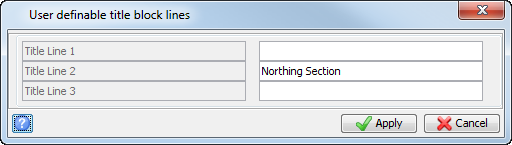
- Enter the information as shown, and click Apply.
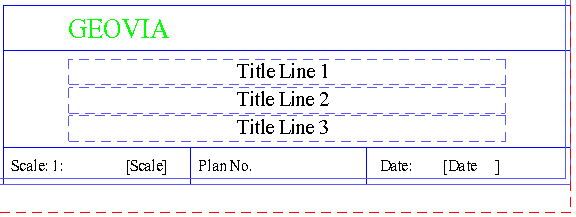
- Using the mouse, zoom to the title block, as shown.
- Choose Title Blocks > Edit > Delete item.
- Click the text Plan No. to delete it.
- Choose Title Blocks > Create > Autoplot section details.
- Click near the previous location of Plan No..
- Enter the information as shown, and click Apply.
- If the section does not appear in the correct location, choose Title blocks > Edit > Move then drag the section to the correct location.
- Choose Title Blocks > Save.
- Choose File > Close to close the Plot Preview window.
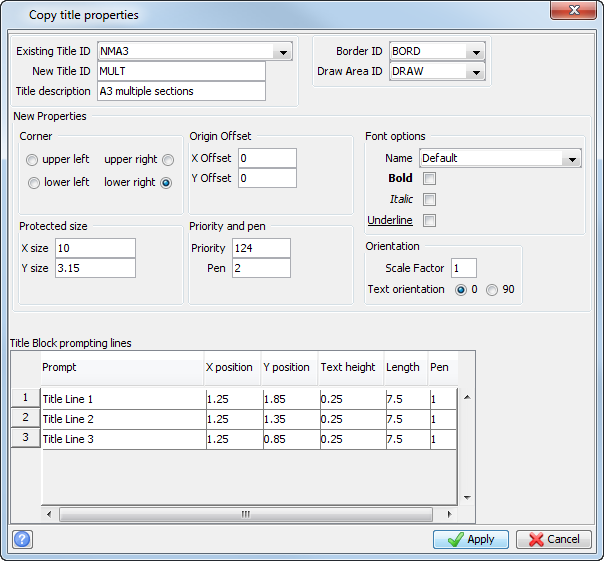
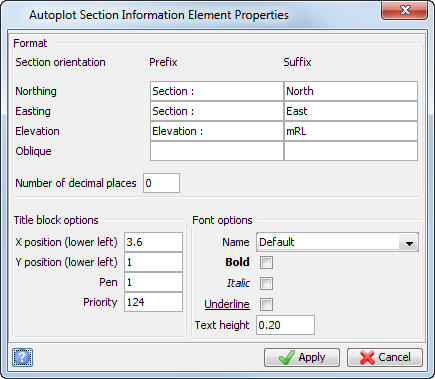
Note: Insert a space after the last character of the Prefix, and before the first character of the Suffix. For example, the Northing Prefix is "Section<space>:<space>".
The field name [Autoplot section] is displayed in the title block.
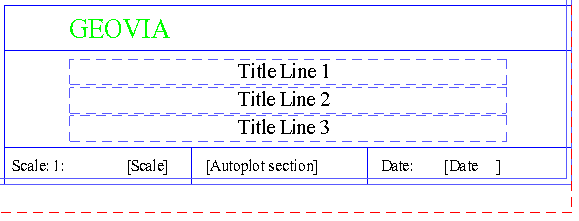
The MULT title block is now ready for use in Autoplot when plotting sections.
Task: Create multiple section plots with solids
- Click Reset graphics.
- Open section_7320_north+solid.swa in Graphics.
- Right-click to the right of the menus, move the cursor to Toolbars, and click Scale and transparency.
- Drag the transparency slider to set the transparency of triangles to 50%.
- Click Autoplot.
- Enter the information as shown.
- Click the Batch sections tab.
- Enter the information as shown.
- Click the Legends tab.
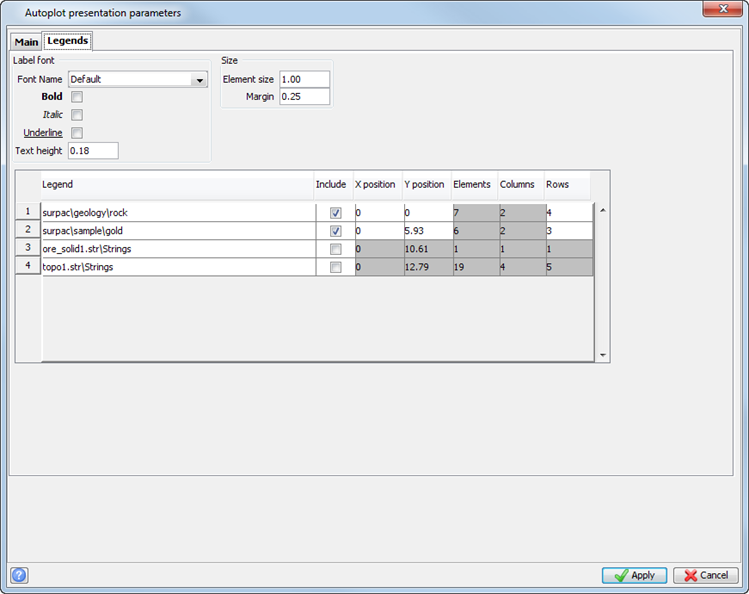
- Enter the information as shown, and click Apply.
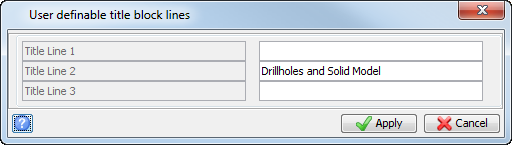
- Enter the information as shown, and click Apply.
- Press F1.
- Click and drag to move the box as displayed.
- Press F2.
- Enter the information as shown, and click Apply.
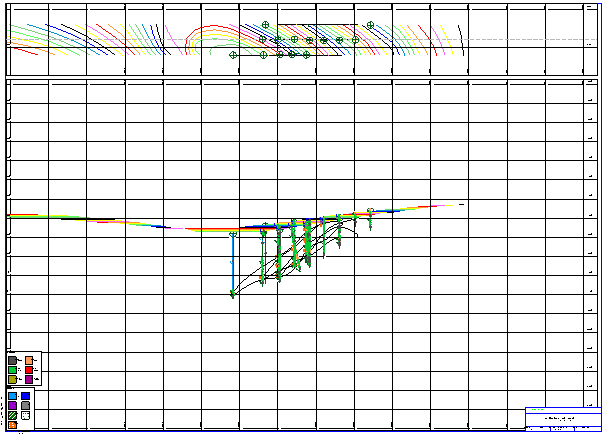
- Open multi_solid_section.dwf in Graphics.
- Zoom in on the title block.
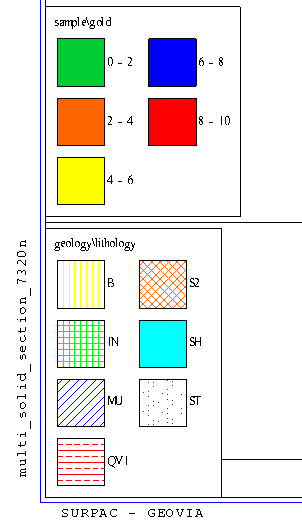
- Zoom in on the legend:
- Open each of the files that were created:
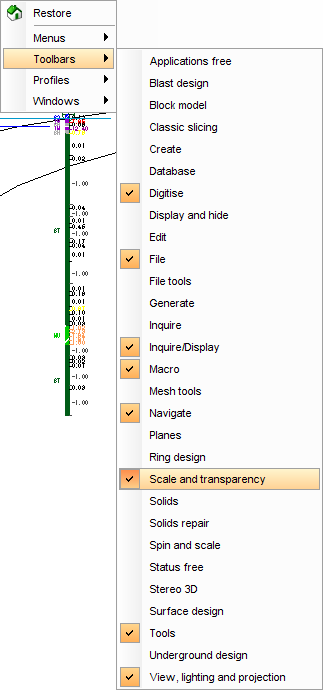

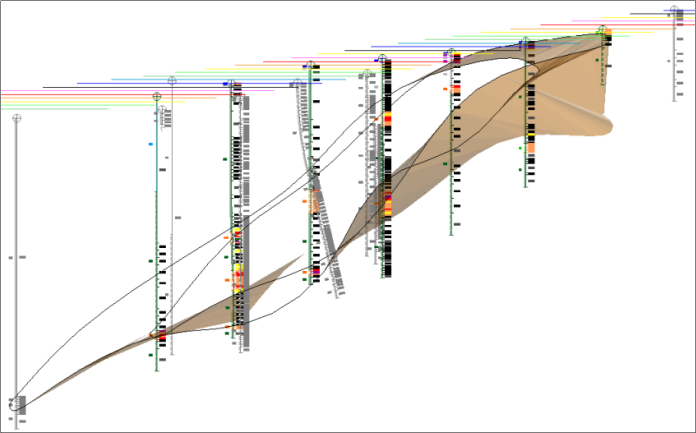
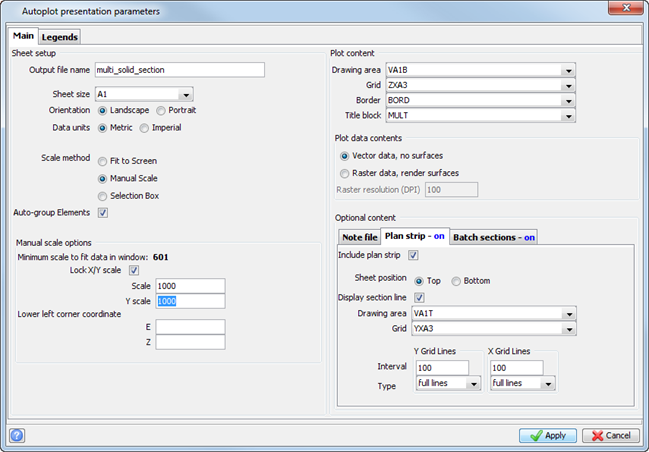
When you select the Drawing area of VA1B in Plot content, the only available option in the Optional content Drawing area is VA1T. Surpac displays only the drawing areas that are appropriate for the selected sheet size.
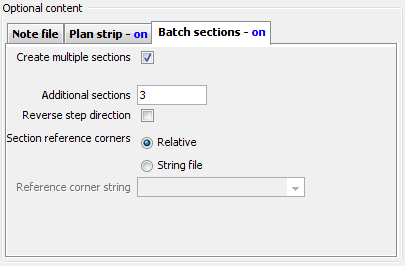
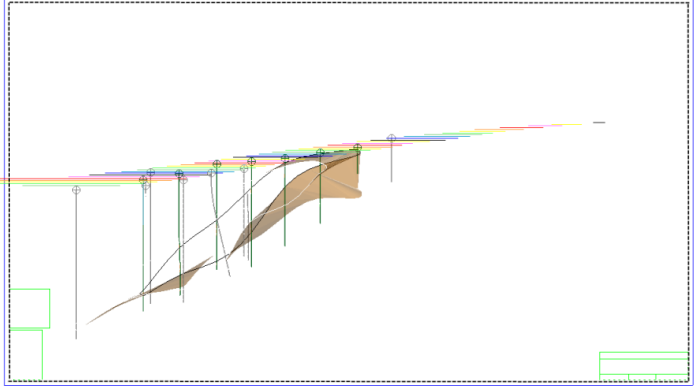
The following files are created:
|
Northing |
Filename |
|---|---|
|
7320 |
multi_solid_section.dwf |
|
7360 |
multi_ solid_section_01.dwf |
|
7400 |
multi_ solid_section_02.dwf |
|
7440 |
multi_ solid_section_03.dwf |
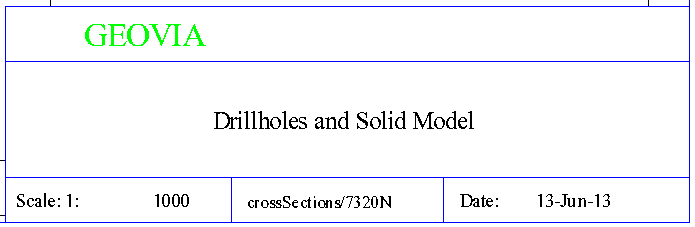
The section number has been automatically appended to the title block.
- multi_solid_section_01.dwf
- multi_solid_section_02.dwf
- multi_solid_section_03.dwf
Note: To see all of the steps performed in this task, run _01e_autoplot_multiple_solid_sections.tcl. You need to click Apply on any forms presented. This macro will only run correctly if the title block MULT has been created.