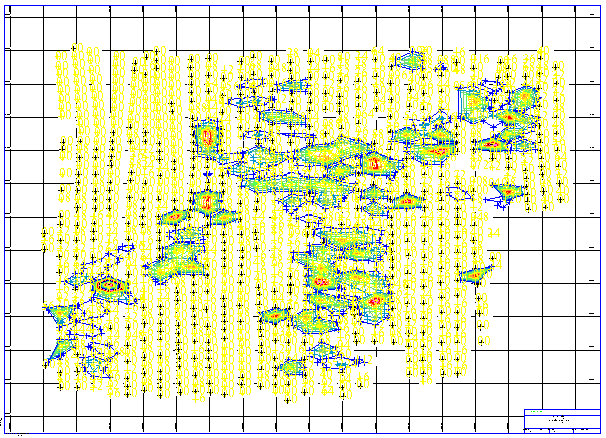
Plan view plotting
Task: Use Autoplot to plot data
- Open soil1.str in Graphics.
- Choose Display > Hide strings > By selection.
- Press ESC.
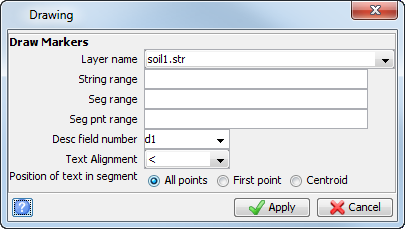
- Choose Display > Point > Markers.
- Enter the information as shown, and click Apply.
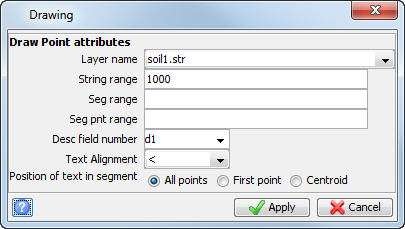
- Choose Display > Point > Attributes.
- Enter the information as shown, and click Apply.
- Choose Plotting > Autoplot.
- Enter the information as shown, and click Apply.
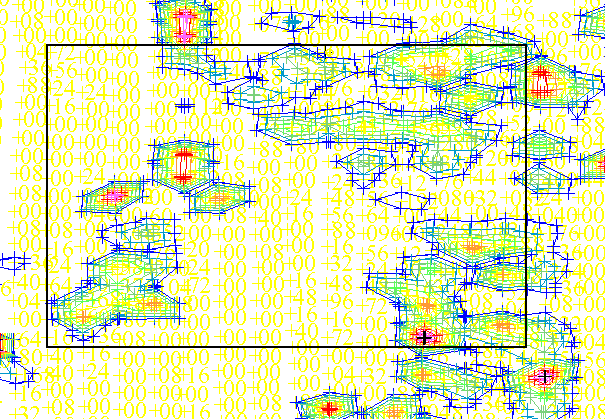
- Click and drag to select a small area of the screen to plot.
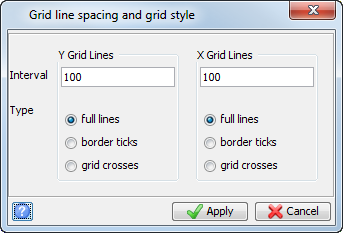
- Enter the information as shown, and click Apply.
- Enter the information as shown, and click Apply.
- Choose File > Close.
Click the strings that you do not want in the final plot. For example, string 1000 represents the soil sample locations and should not be plotted as a line.
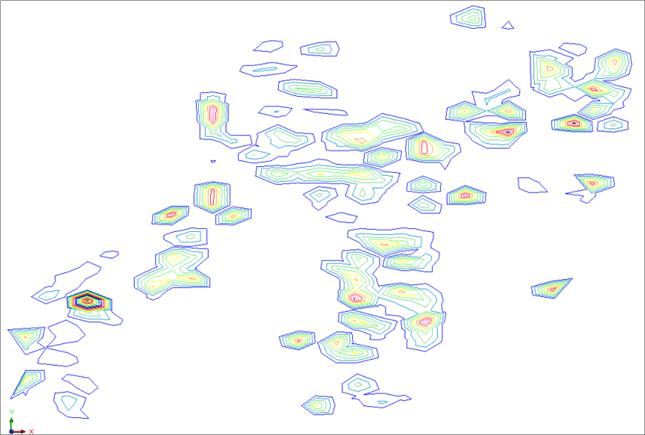
The contours are displayed.
The display is updated with the soil sample locations and grades displayed.
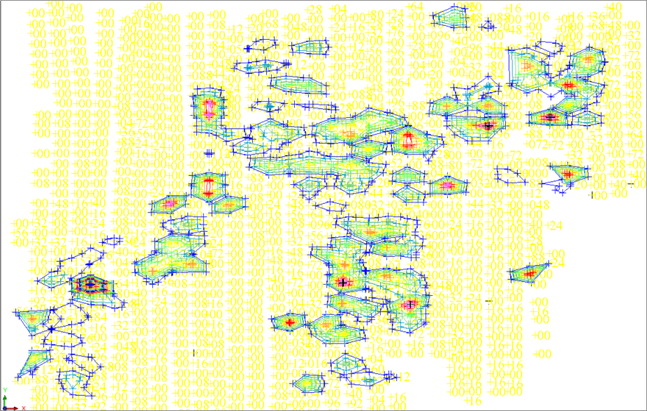
 Note: It is easier to see the grades with a black background.
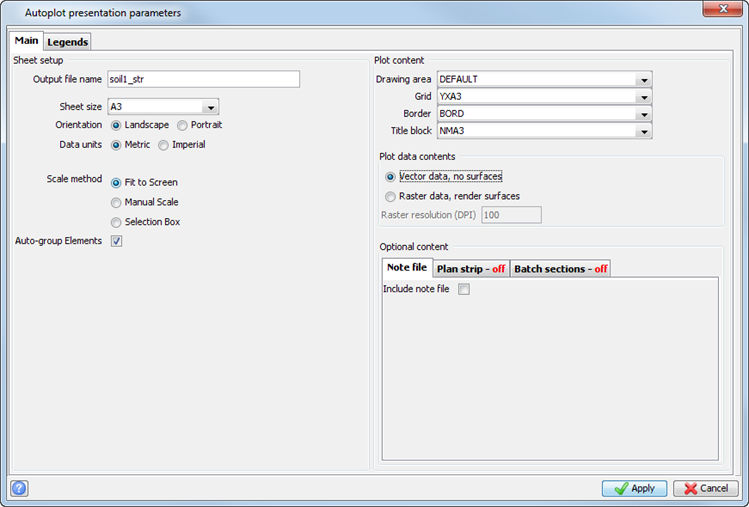
The scale is calculated to fit the A3 paper size.
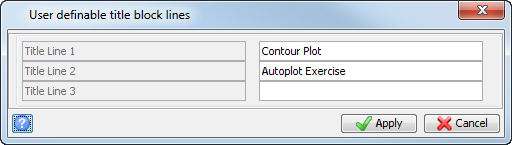
The plot is processed and the Navigator is updated. The layer name is soil1.str so the plot file will be soil1_str.dwf.
Surpac starts the Plot Preview window with the file displayed as shown.