Creating plan view maps
Task: Create an ore block plan
- Choose Plotting > Entity > Edit.
- Select ORE BLOCK, and click Apply.
- After viewing the Define a string entity form, click Cancel.
- Choose Plotting > Map > Edit.
- Select ORE BLOCKS, and click Apply.
- Click Cancel.
- Choose Plotting > Process > Map.
- Select ORE BLOCKS, and click Apply.
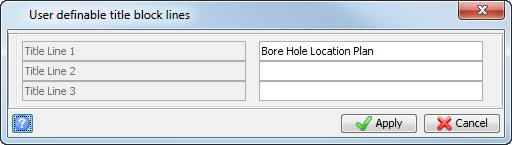
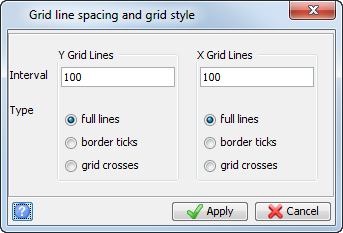
- Enter the information as shown, and click Apply.
- Enter the information as shown, and click Apply.
- Enter the information as shown, and click Apply.
- From the Plotting window menu, choose Create > Text.
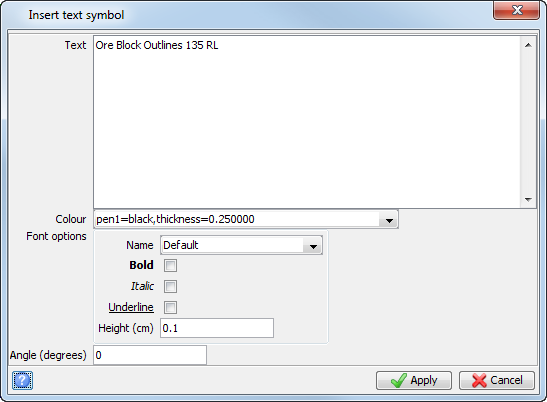
- Click a point for the text to be displayed in the plot, fill in the form as shown, and click Apply.
- Press ESC.
- Choose File > Save, and click Apply to save the file.
The Define a string entity form is displayed. This form defines the ORE BLOCK entity.
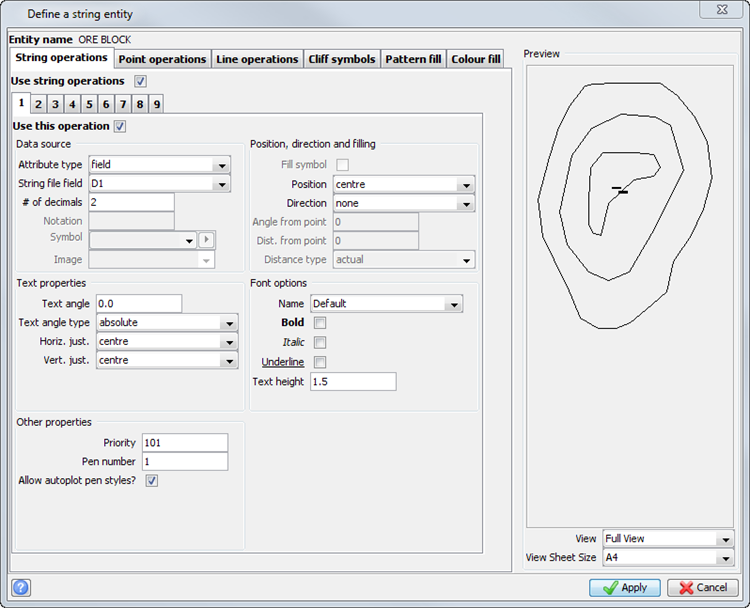
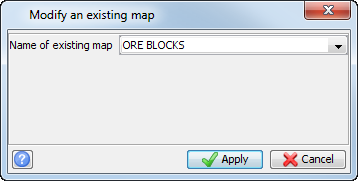
The form displays the fields as shown.
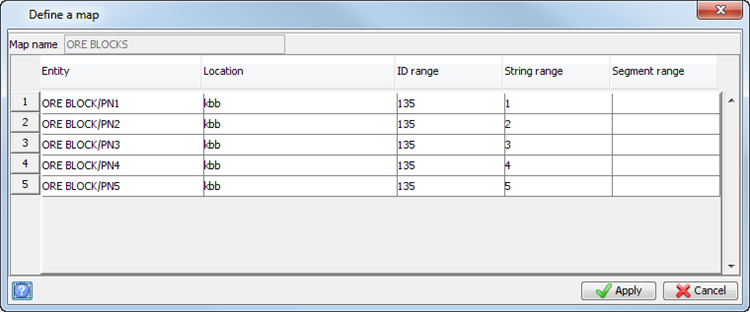
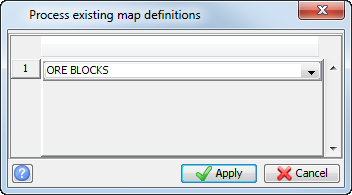
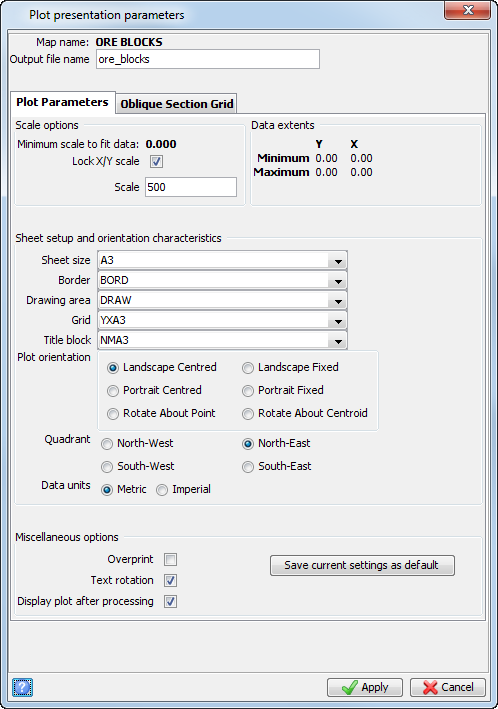
The Display plot after processing check box opens the map in the Plot Preview window. This allows you to view it before plotting.
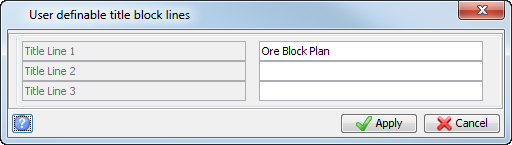
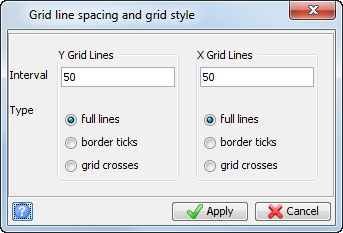
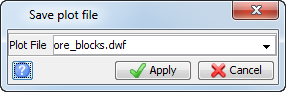
A *.dwf file is created. In this case, the first processed map is named oreblocks.dwf with subsequent maps named oreblocks_01.dwf, then oreblocks_02.dwf,oreblocks_03, with each subsequent map named one number higher in the suffix.
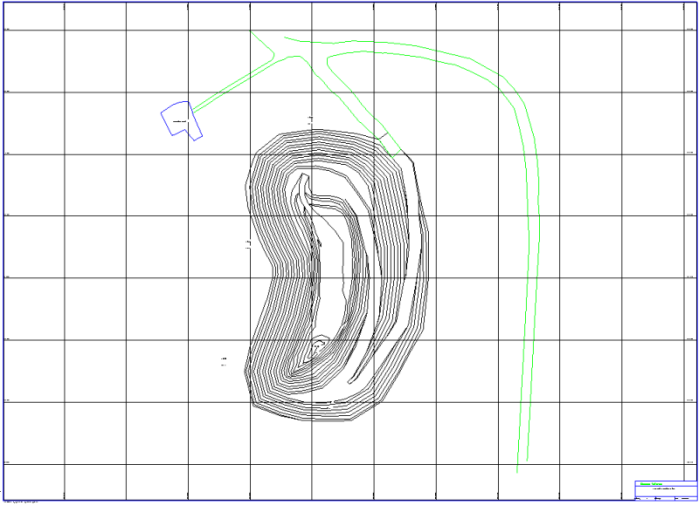
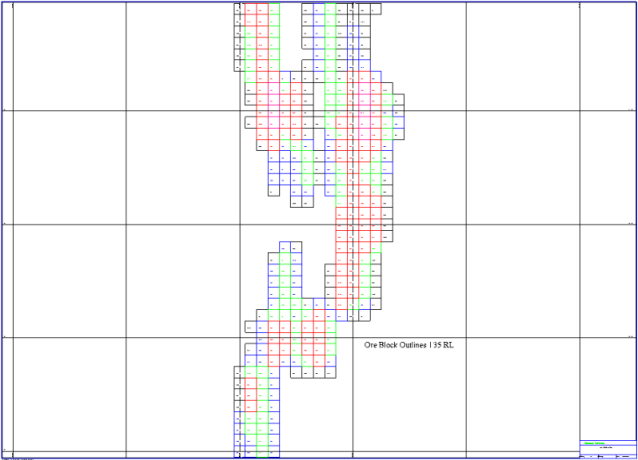
The map is displayed in the Plot Preview window.
 Note: If you do not see any data, make sure that the Plotting folder is set as the work directory in the Plotting window, and repeat this procedure.
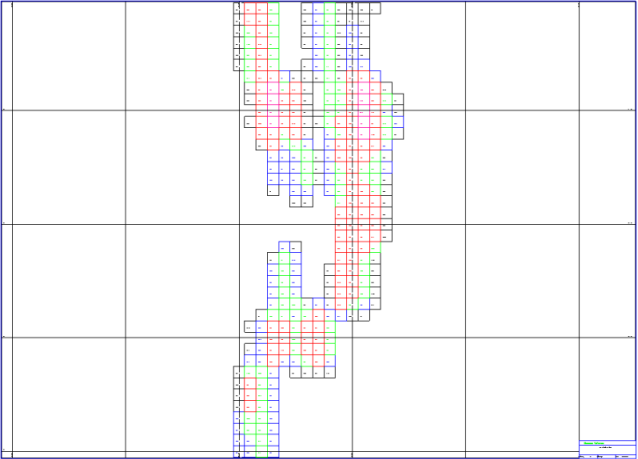
Note: You can edit *.dwf files with a CAD package such as Autocad or Microstation.
Task: View data for plotting
- Click Reset graphics
 .
. - Open pit1.str in Graphics.
- Choose Display > Hide everything.
- Choose Display > Strings > With string numbers.
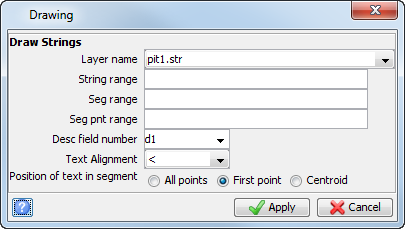
- Enter the information as shown, and click Apply.
- Type CS into the Function Chooser, and press ENTER.
- Choose Display > Strings > With string numbers.
- Enter the information as shown, and click Apply.
- Type CS into the Function Chooser,and press ENTER.
- Choose Display > Strings > With string numbers.
- Enter the information as shown, and click Apply.
- Type PS (for Plot Strings) into the Function Chooser, and press ENTER.
- Enter the information as shown, and click Apply.
- Click Reset Graphics.
- Open site1.str in Graphics.
- Choose Display > Strings > With string numbers.
- Enter the information as shown, and click Apply.
- Type CS into the Function Chooser, and press ENTER.
- Choose Display > Strings > As lines.
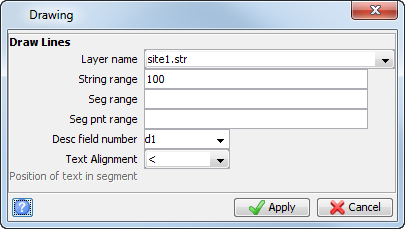
- Enter the information as shown, and click Apply.
- Choose View > Window > In.
- Click and drag a box around the shape in Graphics to window in.
- Press ESC.
- Choose Display > Point > Attributes.
- Enter the information as shown, and click Apply.
- Click Reset Graphics.
- Open bor1.str in Graphics.
- Choose Display > Strings > With string numbers.
- Enter the information as shown, and click Apply.
- Type CS into the Function Chooser, and press ENTER.
- Choose Display > Point > Markers.
- Enter the information as shown, and click Apply.
- Choose Display > Point > Attributes.
- Enter the information as shown, and click Apply.
- Choose Display > Point > Attributes.
- Enter the information as shown, and click Apply.
 Tip: The alias for Hide everything is CS. In all further steps where you want to hide everything, you will be instructed to type CS into the Function Chooser, and press ENTER.
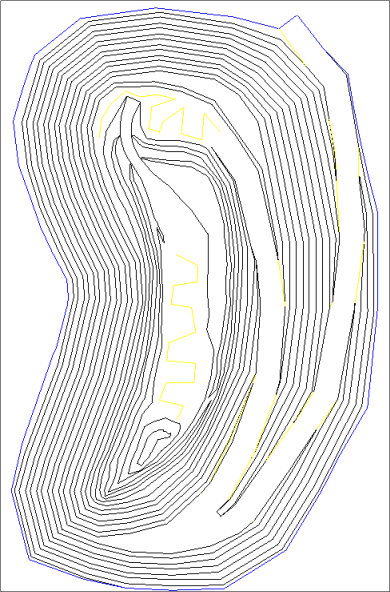
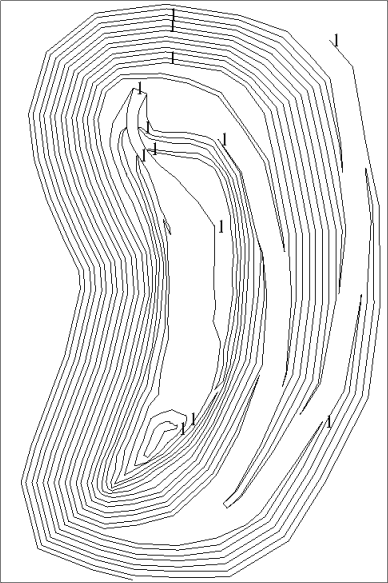
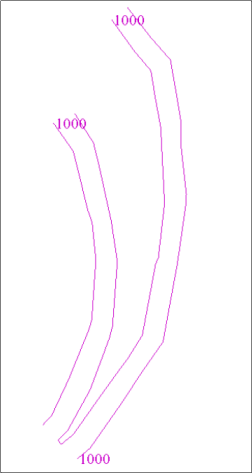
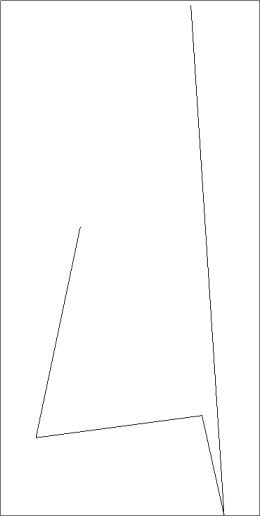
String 1 contains the crest and toe strings for the pit.
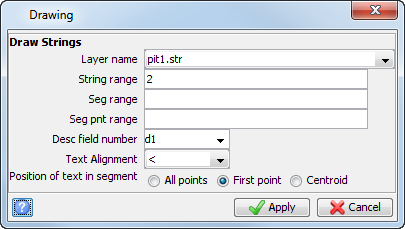
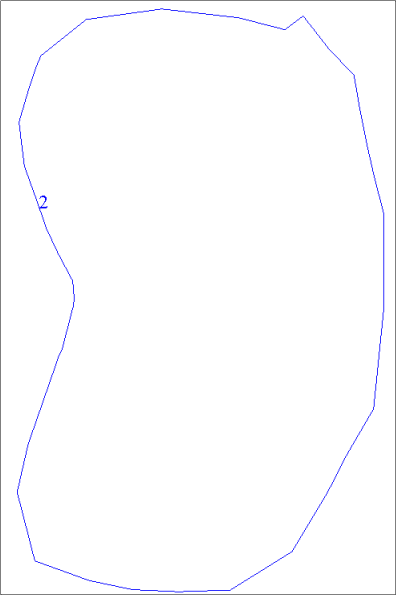
String 2 contains the pit boundary.
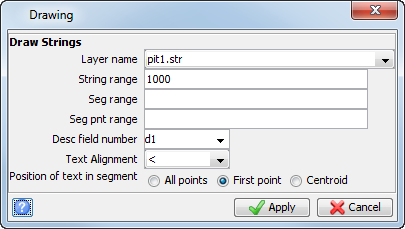
String 1000 contains the ramp.
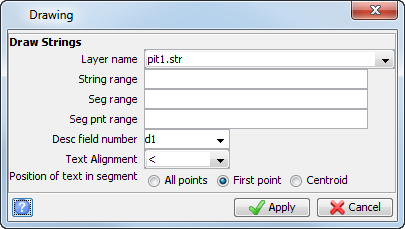
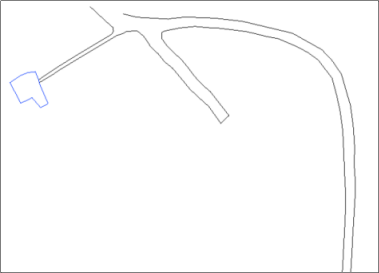
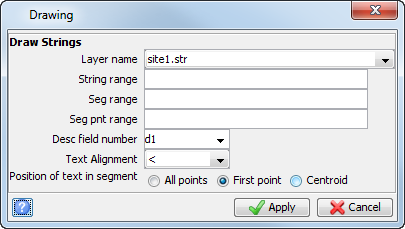
There are three segments for string 1 and a single segment for string 100.
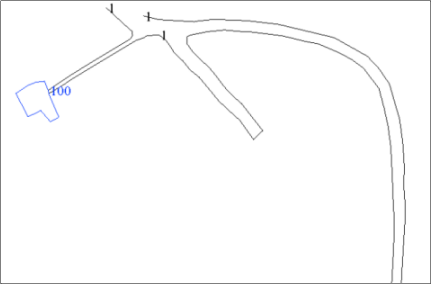

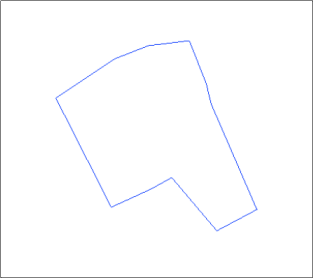
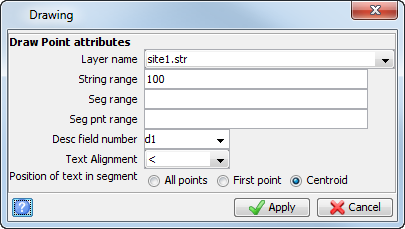
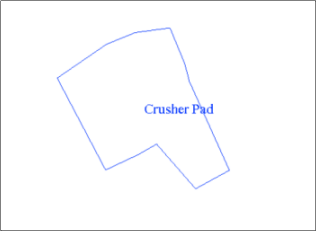
The d1 attribute is displayed at the centroid of the shape.
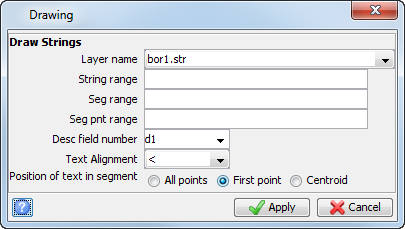
The points are all in string 1.
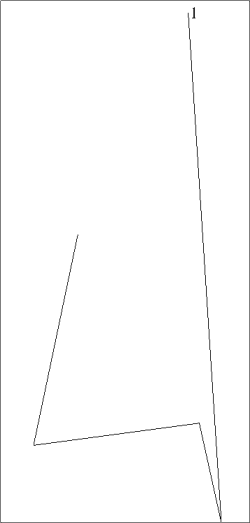
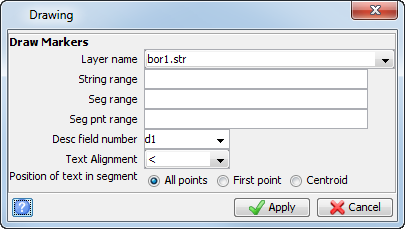
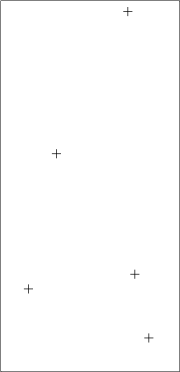
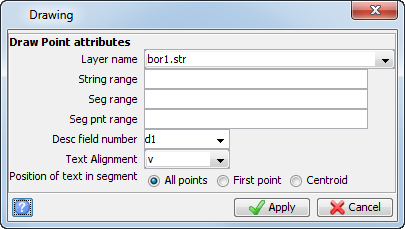
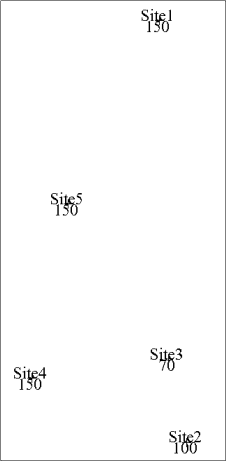
The d1 field is plotted above the markers.
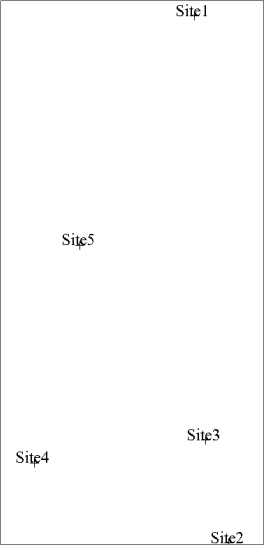
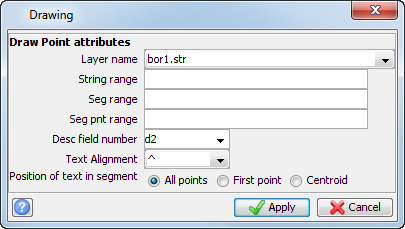
The d2 attribute is plotted below the marker.
Task: Create a borehole location plan
You will create a map from the information presented in the previous task. This map will contain:
|
File |
String Number |
Drawn as |
|---|---|---|
|
pit1.str |
1,2;1000 |
Black line |
|
site1.str |
1 |
Green line |
|
site1.str |
100 |
D1 at centroid |
|
bor1.str |
1 |
Marker, D1 above, D2 below |
|
bor1.not |
|
Text in top right corner |
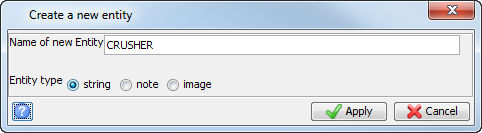
- Choose Plotting > Entity > New.
- Enter the information as shown, and click Apply.
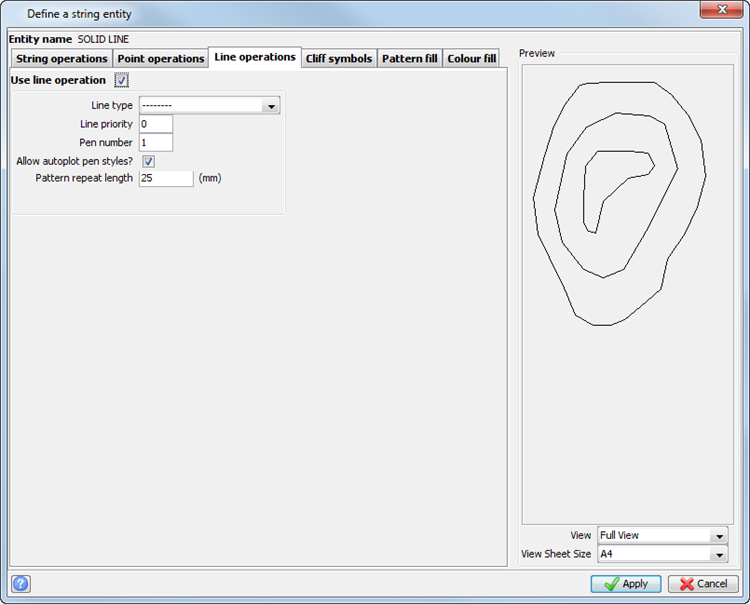
- Select the Line operations tab and select the Use line operation check box.
- Enter the information as shown, and click Apply.
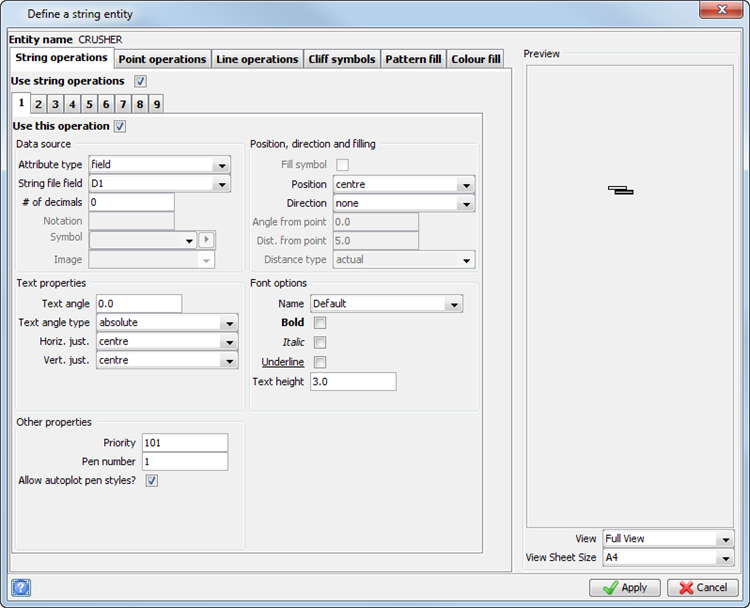
- Choose Plotting > Entity > New.
- Enter the information as shown, and click Apply.
- On String operations tab (1), enter the information as shown, and click Apply.
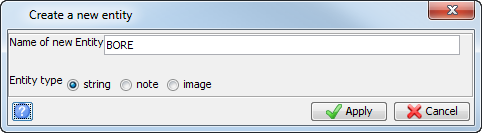
- Choose Plotting > Entity > New.
- Enter the information as shown, and click Apply.
- On the Point operations tab (1), enter the information as shown.
- Select Point operations tab (2), and enter the information as shown.
- Select Point operations tab (3).
- Enter the information as shown, and click Apply.
- Choose Plotting > Entity > New.
- Enter the information as shown, and click Apply.
- Enter the information as shown, and click Apply.
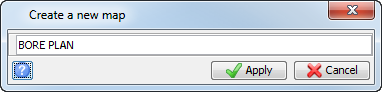
- Choose Plotting > Map > New.
- Enter the information as shown, and click Apply.
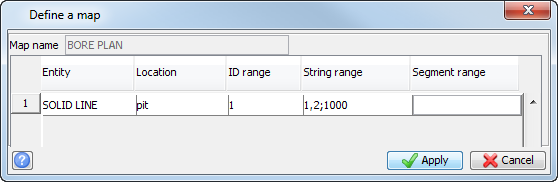
- Enter the information as shown.
- Click in the Segment range column and press TAB to add a new row.
- Add the remaining entities to complete your map definition, and click Apply.
- text height /HTnn (nn = height in millimetres)
- text angle /ANnn (nn= angle in degrees)
- priority /PRnnn (nnn=priority 0 to 125)
- Choose Plotting > Plotting colours > Pen colour properties.
- Click Cancel.
- Choose Plotting > Process > Map.
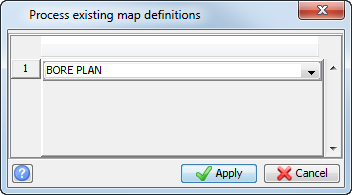
- Enter the map name as shown, and click Apply.
- Enter the information as shown, and click Apply.
- Enter the information as shown, and click Apply.
- Enter the information as shown, and click Apply.
- Choose File > Print plot file.
- Click Apply.
- Click Apply.
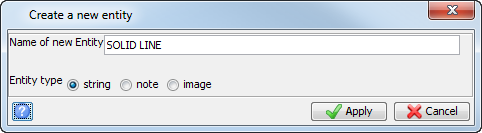
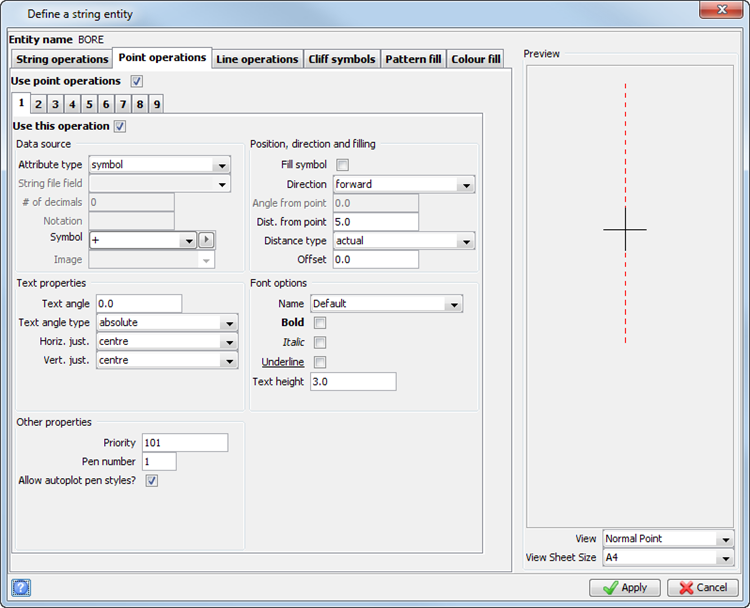
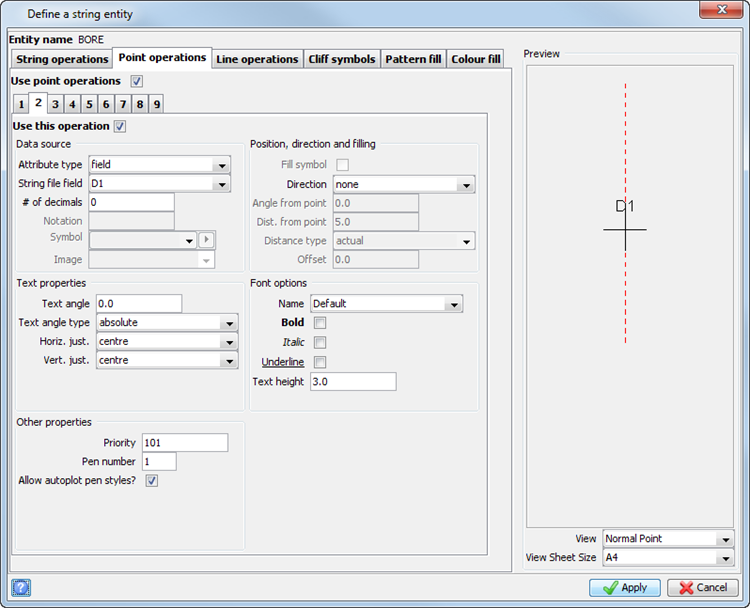
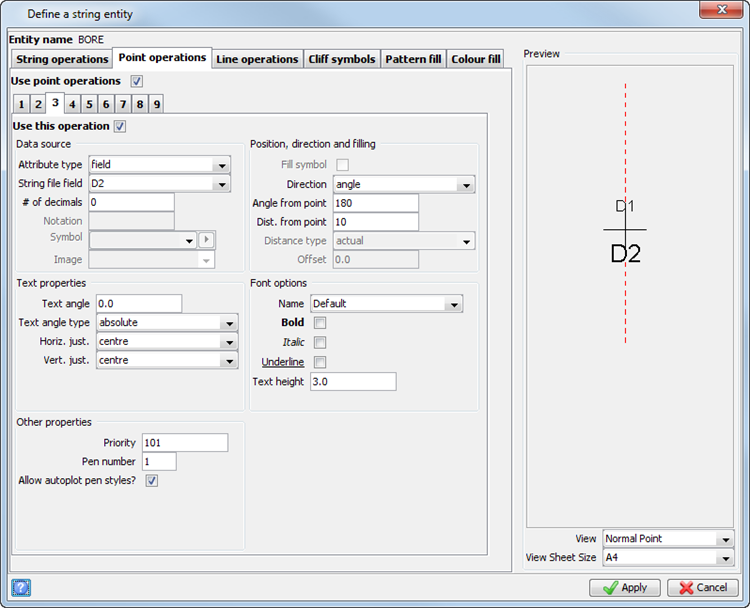
The last entity that you need is a note entity. Note entities allow files of text data to be incorporated into a plot.
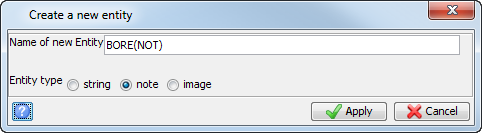
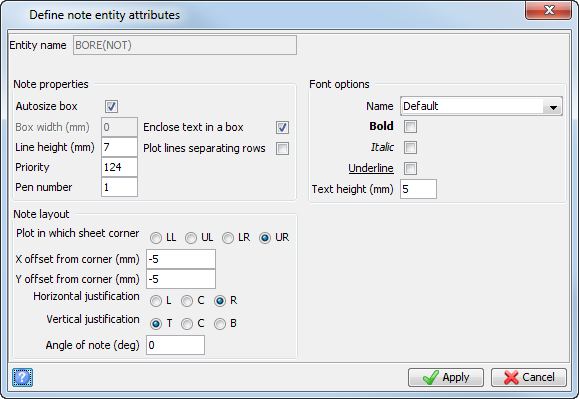
Note: You can position the note relative to any of the four corners of the plotting sheet. After you have specified the corner, you must then nominate the X and Y offsets and the horizontal and vertical justification.
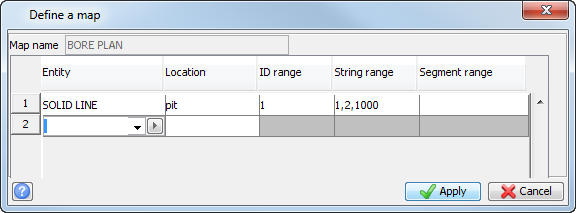
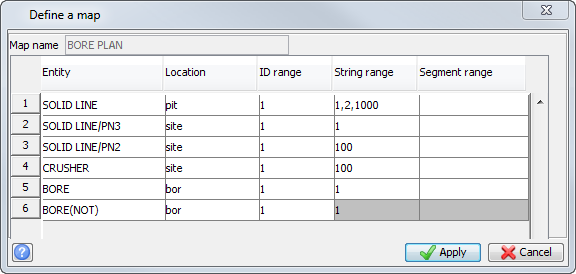
Note: The second entity has been specified as SOLID LINE/PN3. The /PN3 means to use pen 3, instead of pen1 as specified in the original entity definition.
Other modifiers are:
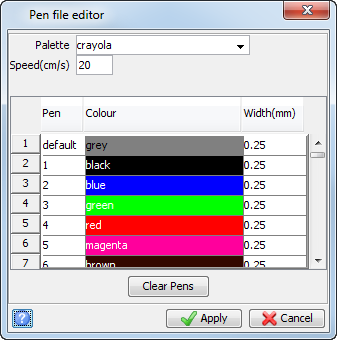
Pen 1 has been assigned to black, Pen 2 to blue, and Pen 3 to green. This satisfies the criteria you set earlier about the use of different colours for different strings.
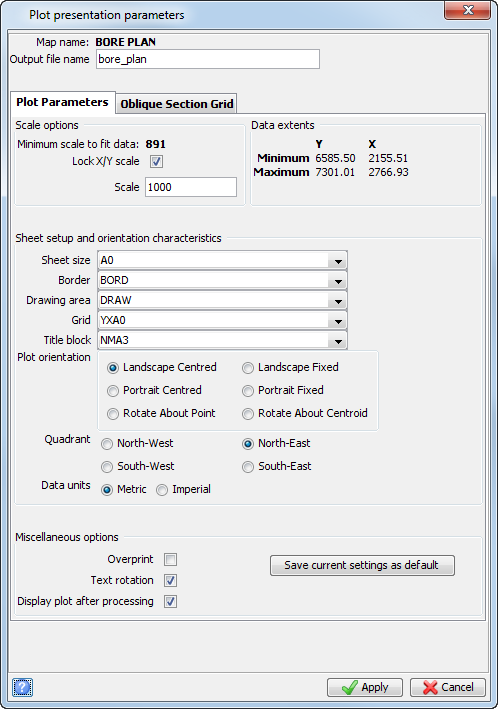
The file bore_plan.dwf is displayed.