Creating multi-viewport maps
Task: Create a plot with two drawing areas
- Choose Plotting > Process > Map.
- Select SECTION VIEW.
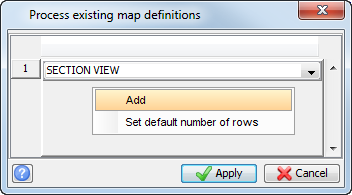
- Right-click in the blank space below the Section View entry and select Add to add another row to the table.
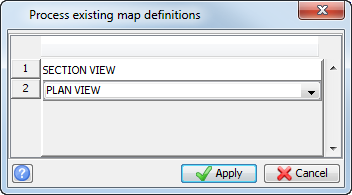
- Select PLAN VIEW , and click Apply.
- Enter the information as shown, and click Apply.
- Enter the information as shown, and click Apply.
- Enter the information as shown, and click Apply.
- Enter the information as shown, and click Apply.
- Enter the information as shown, and click Apply.
- Enter the information as shown, and click Apply.
- Enter the information as shown, and click Apply.
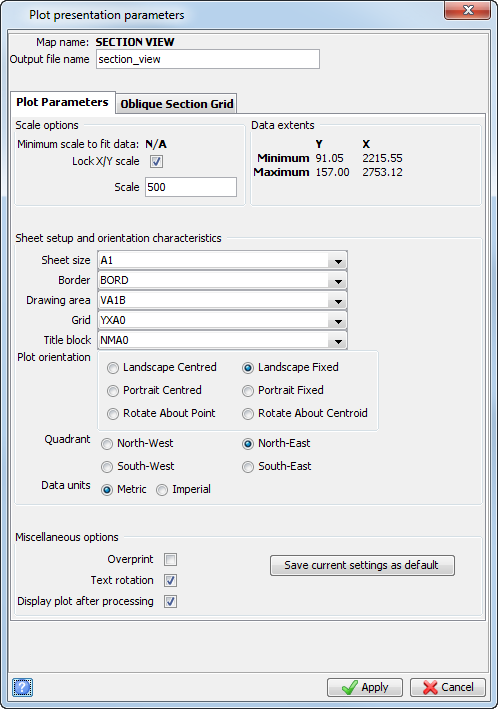
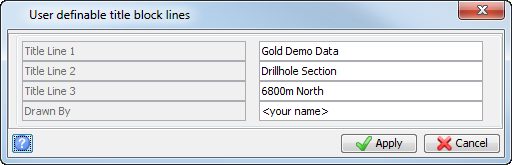
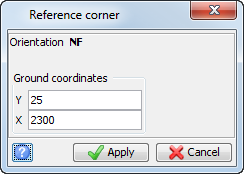
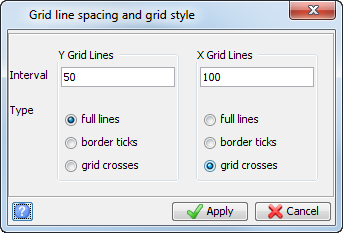
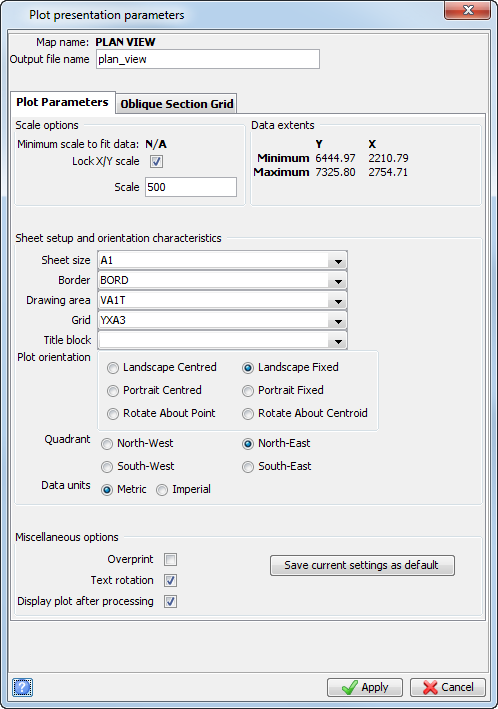
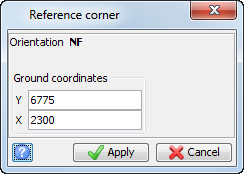
 Note: You usually want to show the entire area of influence for the section. These sections were created using data 25m south and 25m north of the section line. When you enter the reference corner for the plan view map for the 6800m N section, you should lock the lower left corner of the map at 25m south of the section line, or 6800m – 25m = 6775m.
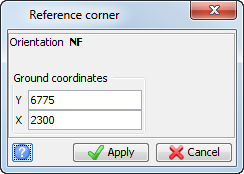
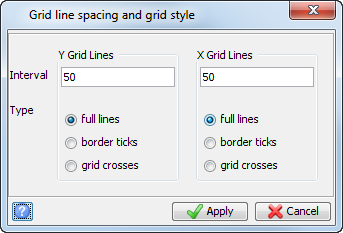
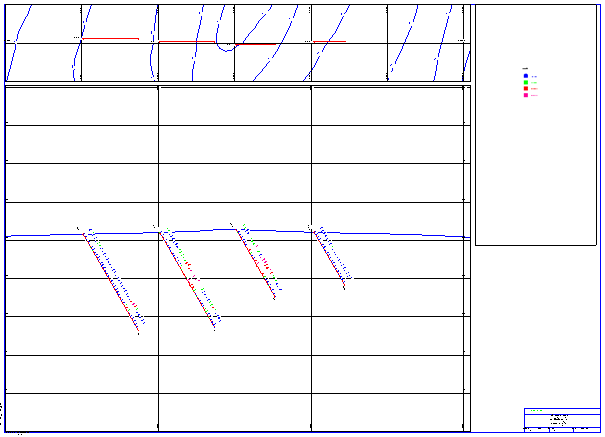
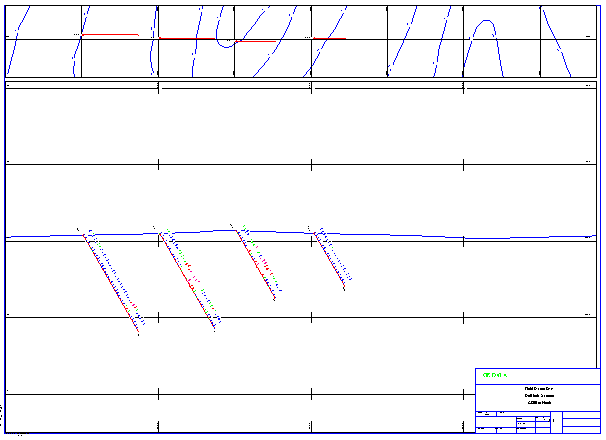
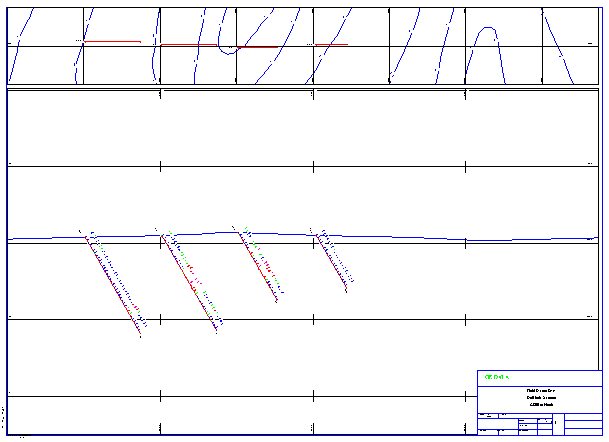
The map is displayed as shown, with the Plan view at the top (in drawing Area VA1T) and the Section view at the bottom (in drawing area VA1B). Both maps are locked at 2300m E so that they align properly.
Task: Modify an existing drawing area
- Choose Plotting > Plotting sheet setup window.
- Choose Drawing areas > Select.
- Select VA1T.
- Right-click in the blank space below the VA1T entry and select Add to add another row to the table.
- Select VA1B, and click Apply.
- Choose Drawing areas > Properties.
- Enter a value of 10.6 for VA1B Top, and a value of 46.4 for VA1T Bottom, and click Apply.
- Choose Drawing areas > Save, to save the modifications.
- Close the Plot Sheet Setup window.
- Choose Plotting > Process > Last map.
- Fill in the Plot Presentation Parameters form to display the VA1B drawing area, and display it using the same settings as you used previously.
- Fill in the Plot Presentation Parameters form to display the VA1T drawing area, and display it using the same settings as you used previously.

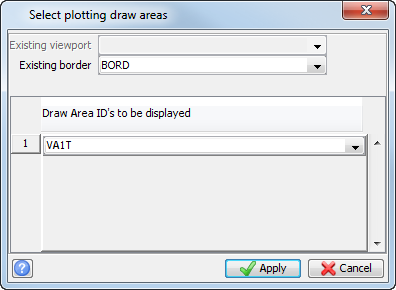
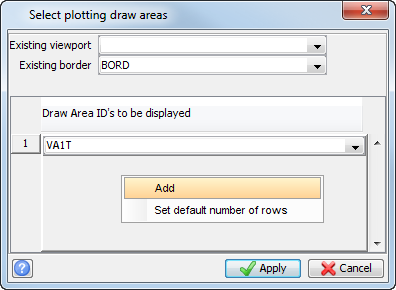
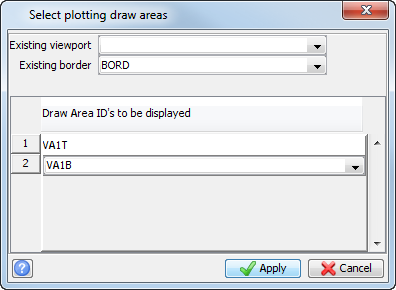
Notice that both drawing areas have been selected, and so both drawing areas are displayed on the screen.
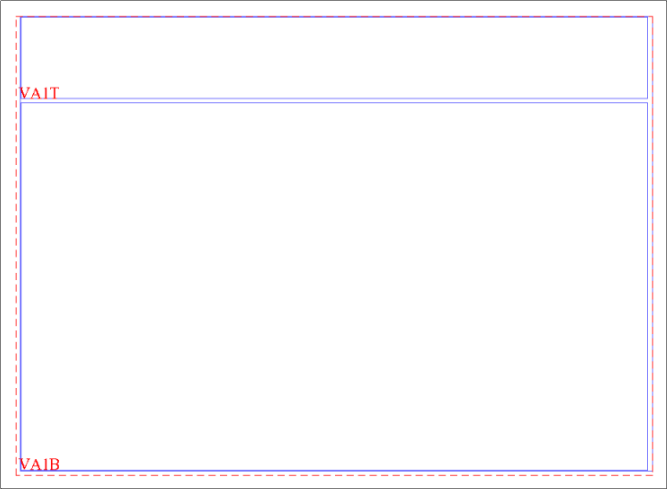
The dimensions of the drawing areas are displayed
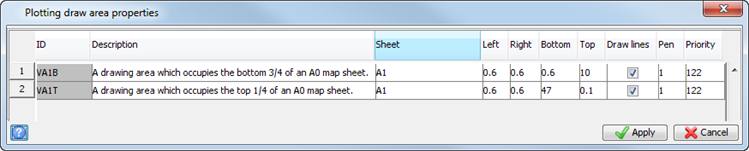
Refer to the above diagram to understand the construction of the drawing areas.
VA1B
Left = 0.6 The distance in from the left edge of the plotting sheet to extent of the drawing area.
Right = 0.6 The distance in from the right edge of the plotting sheet to extent of the drawing area.
Bottom = 0.6 The distance in from the bottom edge of the plotting sheet to extent of the drawing area.
Top = 10 The distance in from the top edge of the plotting sheet to extent of the drawing area.
VA1T
Left = 0.6 The distance in from the left edge of the plotting sheet to extent of the drawing area.
Right = 0.6 The distance in from the right edge of the plotting sheet to extent of the drawing area.
Bottom = 47 The distance in from the bottom edge of the plotting sheet to extent of the drawing area.
Top = 0.1 The distance in from the top edge of the plotting sheet to extent of the drawing area.
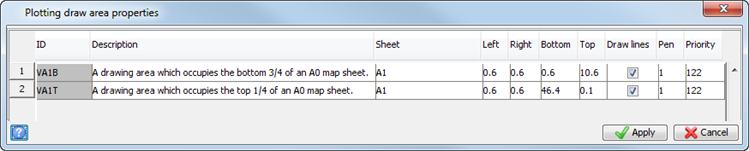
Note: To rescale the drawing areas, you can either choose the properties function as shown above, or you can move the boxes manually using the cursor.
The resulting plot file is displayed.
Task: Add a third drawing area
- Choose Plotting > Plotting sheet setup window.
- Choose Drawing areas > Copy to copy the VA1T drawing area to a new drawing area called PLAN.
- Enter the information as shown, and click Apply.
- Choose Drawing areas > Save.
- Choose Drawing areas > Copy, to copy the VA1B drawing area to a new drawing area called SECTION
- Enter the information as shown, and click Apply.
- Choose Drawing areas > Save.
- Choose Drawing areas > Select.
- Enter the information as shown, and click Apply.
- Choose Drawing areas > New.
- Enter the information as shown, and click Apply.
- Choose Drawing areas > Save.
- Choose Drawing areas > Select.
- Enter the information as shown, and click Apply.
- Close the Plot Sheet Setup window.
- Choose Plotting > Process > Map.
- Enter the information as shown, and click Apply.
- Enter the information as shown, and click Apply.
- Enter the information as shown, and click Apply.
- Enter the following information.
- Enter the information as shown, and click Apply.
- Enter the information as shown, and click Apply.
- Enter the information as shown, and click Apply.
- Enter the information as shown, and click Apply.
- Enter the information as shown, and click Apply.
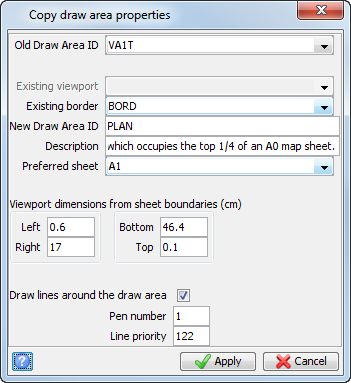
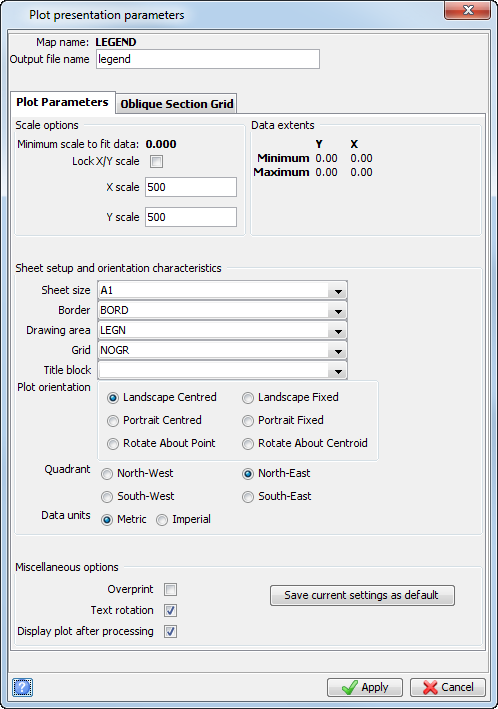
The Right dimension for the sheet boundary has been changed to 17 cm to create room for the LEGN drawing area.
The new PLAN drawing area is displayed.
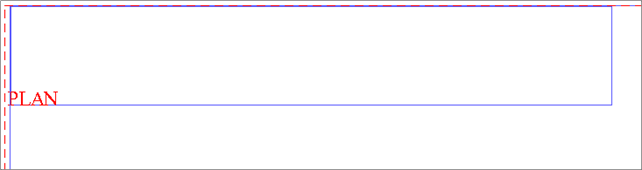
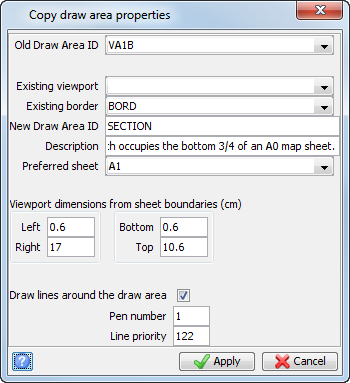
The Right dimension from the sheet boundary has been changed to 17cm to create room for the LEGN drawing area.
The Section drawing area is displayed.
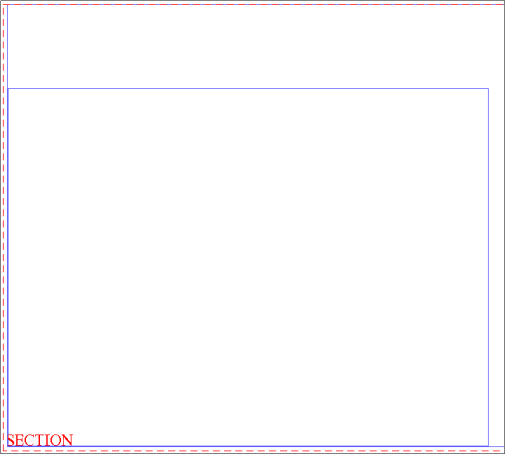
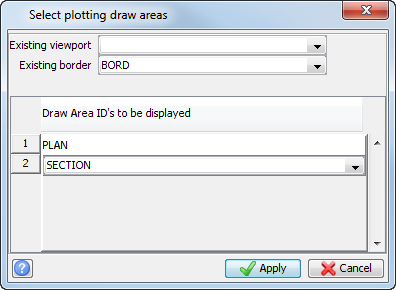
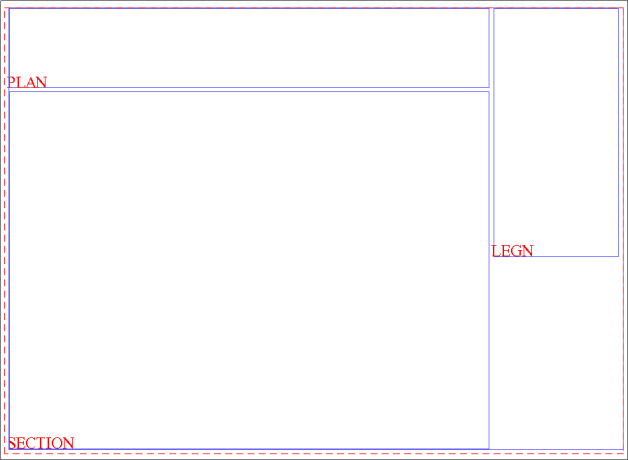
The drawing areas are displayed.
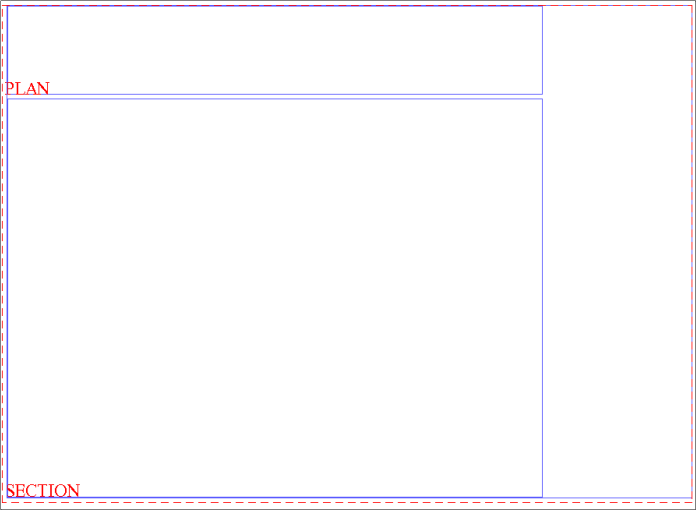
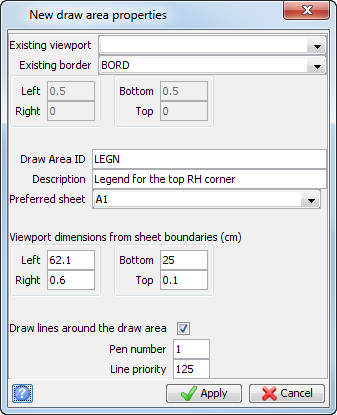
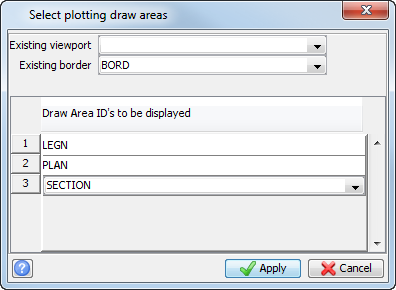
The drawing areas are displayed.
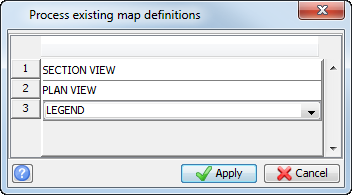
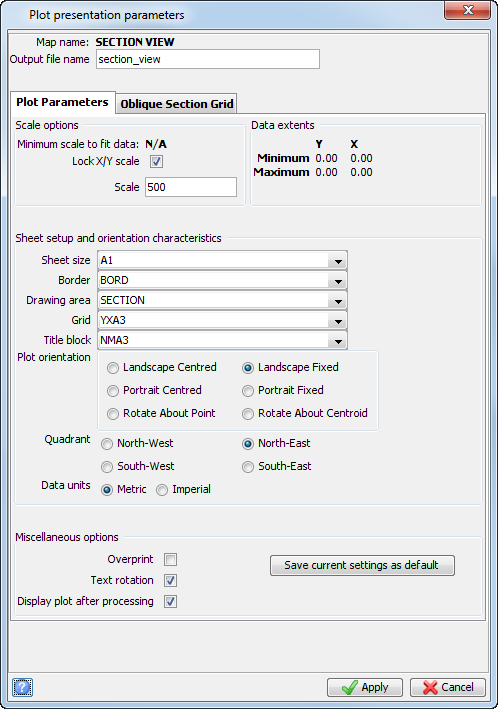
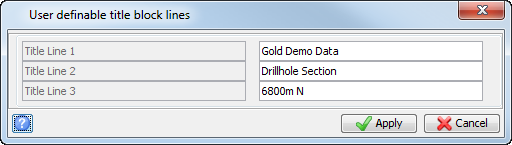
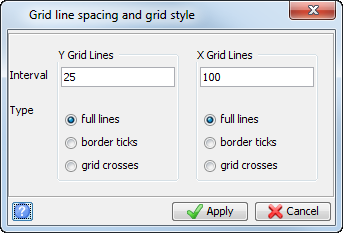
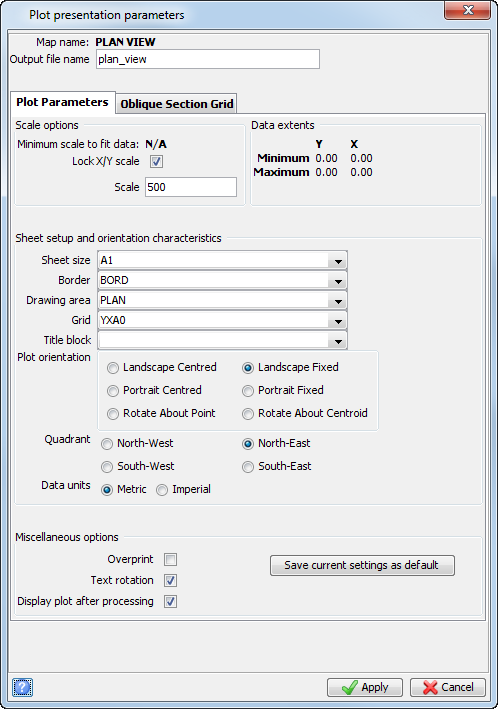
Note: Make sure that you change the drawing area to PLAN (a drawing area for the top of an A1 sheet) and the Title block to "blank" for No title block.
After the map has finished processing, it is displayed in the Plot preview window, showing drawing areas PLAN, SECTION, and LEGN.