


Surface or solid with colour banding
You use this function to draw a solid with colour banding, that is advanced visualisation. The advanced visualisation features are:
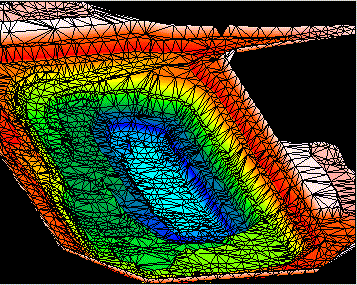
- colouring of triangles to interpolate colours across triangle faces based on triangle vertex values. That is, solid colour bands of contours or colour interpolation to give a smooth transition in colour from one contour value to the next.
- colouring of triangle faces by defining a list of algebraic expressions that use values from the triangle description field or from the triangle vertex x, y, z, or description fields or the triangle dip or dip direction to determine the colour to be used.When you use the CLASSIFY DTM TRIANGLES function to assign categories to triangles within nominated boundary segments, DRAW DTM/3DM then provides a Geographic Information System (GIS) capability .
- advanced rendering when using lights by using either Gouraud or Phong shading.
Prerequisites: A surface or solid must be open.
To run this function: Choose Solids > Display > Object with colour banding, or...
Fields on the Surface or solid colour banding form
| Field | Description |
|---|---|
| Layer name |
The name of the layer that contains the data to colour. The active layer is the default value. You can draw data from all layers in Graphics by leaving this field blank. |
| Object Range |
The string or triobject range to draw in Graphics. The range must be a standard range specifier. You can leave this field blank to draw all objects in the active layer. |
| Trisol Range |
The segment or trisolation range to draw in Graphics. The range must be a standard range specifier. You can leave this field blank to draw all trisolations of each object you are drawing. |
| Triangle Range |
The triangle range to draw in Graphics. The range must be a standard range specifier. You can leave this field blank to draw all triangles in each trisolation you are drawing. The triangle range can be useful when your are trying to diagnose problems in creating 3DMs, for example, when you want to see if you have unintentionally created duplicate triangles. |
| Field to colour by |
The name of the field, in the string file, to use for interpolating the colours across the triangle faces. Valid entries include; X, Y, Z, and description fields. You only need to define the field to colour by if you are using the bands of specified size, set number of bands or range for bands colouring options. |
| Banding Type |
These options determine how the trisolations will be drawn. The meanings of the banding types are shown in the following table. |
| Banding Type | Result |
| none | No triangle colouring occurs. The trisolations are drawn with the colour defined in the drawing styles file associated with the active graphics layer. |
| bands of specified size |
Triangle colouring is performed by drawing colour bands of a specified thickness where the top and bottom of each colour band is exactly on a contour value . The contour value is determined by Field to colour by and Size of bands. When you select this option, the Size of bandsfield is displayed,. This value is the thickness of each band of colour. For example, when you are colouring on the Z field with four colours (blue, green, yellow, and red) and Size of bands is 5, the first 5 units of elevation are coloured blue, the next 5 are coloured green, and so on. After 20 units of elevation, the colour sequence is repeated. |
| set number of bands | The object is coloured by the number of colour bands you specify. This is determined by Field to colour by and the number of colours. |
| range for bands | Triangle colouring is performed by entering a range to define the size of each of the colour bands. This allows you to have bands of different sizes rather than a fixed size.
|
| using algebraic expressions |
Triangle colouring is performed by using algebraic expressions to determine when to use the specified colours. You define a list of colours and the expression associated with each colour. If the expression results in a value of zero, the colour is not used. If the value is not zero, the triangle is drawn in the colour, and no further expressions in the list are considered for that triangle. Expressions are processed in the order they appear in the list, so that the triangle is drawn in the colour of the first expression that results in a non-zero value. The expression can use the following variables.
D1, D2, D3, ..., D100 These variables refer to the values stored in the description fields of the triangle. See the CLASSIFY DTM TRIANGLES function to see how values can be assigned to the triangle description fields. AVGD1, AVGD2, AVGD3, ..., AVGD100 These variables refer to the arithmetic mean of the values from the description fields of the three points used for the vertices of the triangle. The values in the point description fields must be numeric for this to be successful. These variables effectively refer to the value of the point description fields at the triangle centroid position. Processing will stop with an error message if a non-numeric value is encountered. X, Y, Z These variables refer to the triangle centroid X, Y or Z value. DIP This variable refers to the maximum dip, expressed in decimal degrees, of the triangle. Values are always positive and range between 0 and 90 degrees in value. DIPDIR This variable refers to the direction of the maximum dip, expressed in decimal degrees. DIPDIR has a value >= 0 and < 360. The direction always points in the downhill direction of the maximum dip. |
Some examples of algebraic expressions.
| Colour | Algebraic expression | Description |
|---|---|---|
| blue | dip >= 0 & dip < 10 | Use blue to draw triangles whose dip is greater or equal to 0 degrees and less than 10 degrees |
| green | dip >= 10 & dip < 45 | Use green to draw triangles whose dip is greater or equal to 10 degrees and less than 45 degrees |
| orange | dip >= 45 & dip < 60 | Use orange to draw triangles whose dip is greater or equal to 45 degrees and less than 60 degrees |
| red | dip >= 60 | Use red to draw triangles whose dip is greater or equal to 60 |
Output
The objects and trisolations specified are coloured with the banding you specified.
 Note: You can create other special effects using the LIGHT ON function with either Gouraud or Phong shading. See TOGGLE COLOUR INTERPOLATION and TOGGLE COLOUR INDEX INTERPOLATION for other ways to modify rendering effects.
 DTM colour banding without colour interpolation.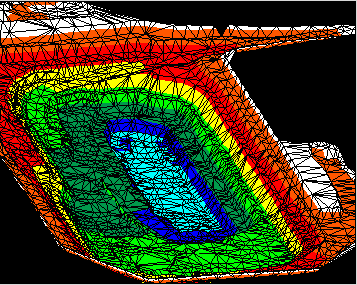
 shear
shear mafic
mafic dyke
dyke sill
sill host
host