


Scale Bar
This function allows you to insert a scale bar that gives a graphical representation of the map scale into the title block.
Prerequisites: A title block is displayed in the Plot Sheet Setup window.
To run this function: In the Plot Sheet Setup window, choose Title Blocks > Create > Scale bar, or...
An example of a scale bar is as follows.
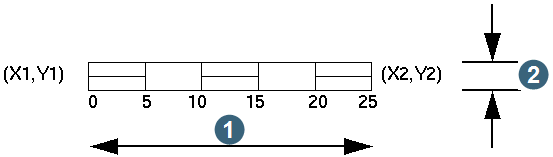
|
1. 5.0 cm 2. 0.25 cm |
The following message is displayed.
Click and drag to define the location for a title block scale bar
Using the mouse, click and drag to define a rectangle that will define the location, size and orientation of the scale bar. If the rectangle that is created using the mouse is longer than it is high, the scale bar will have a horizontal alignment. This is useful for title blocks positioned such that they are viewed from the bottom edge of the map sheet. If the rectangle that is created using the mouse is higher than it is long, the scale bar will have a vertical alignment. This is useful for title blocks positioned such that they are viewed from the right edge of the map sheet. Define the scale bar location to display the PLOT SCALE BAR ELEMENT PROPERTIES form.
Fields on the Plot scale bar element properties form
X position, Y position - (lower left)
The values for the X and Y positions are obtained from the lower left corner of the defining rectangle defined by the mouse selection. These values are relative to the lower left corner of the title block. You may modify these values if they are not suitable.
X position, Y position - (upper right)
The values for the X and Y positions are obtained from the upper right corner of the defining rectangle defined by the mouse selection. These values are relative to the lower left corner of the title block. You may modify these values if they are not suitable.
Together, these values define the length and height of the scale bar itself. The longest dimension will be divided into 5 equal size parts and appropriate annotations, dependent on the map scale when processing the map, will be placed to define the length of the map scale.
Pen
The pen number is associated with a colour through a pen file that can be easily modified to suit your requirements. An example value is 1.
Priority
Each item, line, text, symbol, etc. that is drawn on a map has a priority that is used to determine how items that clash should be drawn, or omitted. Title blocks should be designed so that there are no clashes between items within the title block. If items are placed outside the title block rectangle, pattern legends for example, it is important that they be given a priority high enough to ensure other map components do not clash them from the map. An example value is 124.
Number of Decimals
This will determine how many decimal points will be show on the numbers in the scale bar. A value of zero will produce no decimal points. The decimal point values can only be seen in the plot viewer.
Font Options
Name
Select the font name. An example value is Default.
Bold
Check this box for bold text.
Italic
Check this box for text in italics.
Underline
Check this box for underlined text.
Text height
The text height of the text used to label the scale bar when it is drawn on the map must be expressed in centimetres. An example value is 0.2.
Note: There are some minor known issues with fonts and the plot previewer.
Text angle
The text angle is expressed in decimal degrees with 0 giving horizontally aligned text and 90 giving vertically aligned text.
Complete the PLOT SCALE BAR ELEMENT PROPERTIES form and choose Apply to draw the scale bar in the required location in the title block.