Legends for strings
A number of the functions which draw string data permit a legend to be created to aid in the interpretation of the data which is drawn. The legends are presented in a separate viewport in a number different styles with the presentation style being dependent upon the DRAW function which was used to create the legend.
The functions which permit legends to be drawn and the presentation style used for the legends are:
| Function name | Legend presentation style |
|---|---|
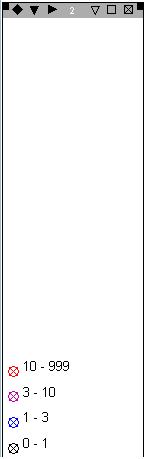
| DRAW MARKERS | The legend is presented with a title and, for each different style string which is drawn, the marker style and a corresponding label are included in the legend.
The marker style and corresponding label are defined using the STYLE STRINGS function. If more than one string use the same style, then that marker style is only included in the legend once. |
| DRAW LINES DRAW STRINGS DRAW SEGMENTS |
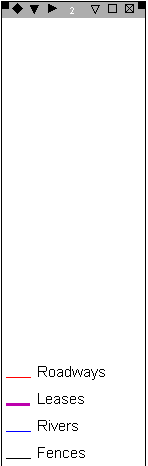
The legend is presented with a title and, for each different style string which is drawn, the line style and a corresponding label are included in the legend.
The line style and corresponding label are defined using the STYLES STRING function. If more than one string use the same style, then that line style is only included in the legend once. |
| DRAW POLYGONS DRAW POLYGONS LABELS |
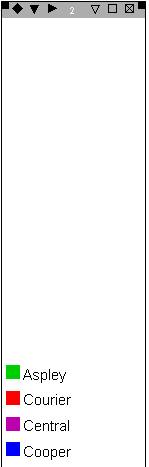
The legend is presented with a title and, for each different style string which is drawn, the polygon style and a corresponding label are included in the legend.
The polygon style and corresponding label are defined using the STYLES STRING function. If more than one string use the same style, then that polygon style is only included in the legend once. |
| BM GRAPHICS COLOUR ATTRIBUTE | The legend is presented with a title and, for each discrete class defined in the Ranges for colour selection a legend entry is created as a polygon of the defined colour and style and with an appropriate label. |
| DRAW SHELLS | The legend is presented with a title and, depending on the state of the TOGGLE COLOUR INTERPOLATION function, will be presented in one of two possible styles.
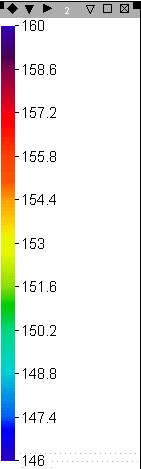
If colour interpolation is enabled, the legend will be presented as a strip containing smooth shaded colours. If colour interpolation is disabled, the legend will be presented as a polygon legend. The labelling in each case is created from the value range of the data which is being used to compute the colours for the SHELL. |
Viewport management
Viewport management functions for viewports that contain legends are restricted as it is inappropriate to perform many tasks in these viewports. The only viewport management tasks which may be performed on viewports containing legends are:
- Destroy a viewport
- Minimise a viewport
- Maximise a viewport
- Resize a viewport
- Move a viewport
- Click in the viewport with the mouse and use the viewer to move the legend for those situations where there are so many legend entries that some are outside the viewport to the top. Note that the Viewer Dolly mode is enabled in these viewports as it is the most suitable viewing mode.
Note that it is not possible to make a viewport containing a legend the active viewport.
Legend Examples
Below are examples of the different types of legends which can be created.
| Marker legend | Line legend | Polygon legend | Shell legend |
| Created by the DRAW MARKERS function. | Created by the DRAW LINES, DRAW SEGMENTS and DRAW STRINGS functions. | Created by the DRAW POLYGONS, DRAW POLYGONS LABELS, and the BM GRAPHICS COLOUR ATTRIBUTE function.
Also created by the DRAW SHELLS function but only when colour interpolation is disabled. |
Created by the DRAW SHELLS function but only when colour interpolation is enabled. |
|
Gold grades |
Features |
Ore zones |
Elevations |