


Database reports
Database Data Extent
With this function you can extract a summary of the minimum and maximum northing, easting, elevation and depth for all of the holes in the collar table of your database, along with the total length of drilling stored in your collar table.
To run this function: Choose Database > Report > Database extent, or Design > Blast design > Report > Database extent, or...
Database data summary form
Database
This contains the name of the current database and cannot be changed in this form.
Name of output file
Enter the name of an output file if you wish to store the database data extent for further use. This will be given a ".NOT" extension regardless of whether you enter an extension here.
Choose Apply from the DATABASE DATA SUMMARY form to save the results in the specified output file name.
The form displays the number of holes in the current database, the total length drilled in the current database (based on the maximum depths for each hole stored in the Collar table), and the minimum and maximum values for northing, easting, collar RL and hole depth.
If an output file has been selected, the results will be written out to your hard disk.
                        DATABASE DATA EXTENT
========================================================================
       Database: gold                    Date: 10-Nov-92

   Number of drillholes :28           Total length drilled :1735.30

              Hole ID     N           E           Z           DEPTH
------------------------------------------------------------------------
  MIN. N      RC025       6747.300    2350.000    154.000     66.010
  MAX. N      RC004       7053.500    2502.100    153.920     42.990
  MIN. E      RC013       6889.180    2345.820    153.100     75.920
  MAX. E      RC004       7053.500    2502.100    153.920     42.990
  MIN. Z      RC013       6889.180    2345.820    153.100     75.920
  MAX. Z      RC012       6937.870    2492.820    157.000     54.290
  MIN. DEPTH  RC028       6748.140    2501.000    154.570     30.220
  MAX. DEPTH  RC005       7000.600    2349.500    154.080     86.570
------------------------------------------------------------------------
|
The output from this function can optionally be a text file which can be printed out, viewed in any text editor or word processor, or incorporated into a hard copy plot using the PLOTTING module.
Database Summary
This function will extract the total number of records stored in each table of your database and indicate whether the optional tables are time dependent or not.
To run this function: Choose Database > Report > Database summary, or Design > Blast design > Report > Database summary, or...
Database tables summary form
You may enter the name of an output file if you wish to store the database summary for further use. This file will be given a ".NOT" extension regardless of whether you enter an extension here.
The output from this function can optionally be a text file which can be printed out, viewed in any text editor or word processor, or incorporated into a hard copy plot using the PLOTTING module.
Collar Summary
With this function you can produce a summary of all of the collar information stored in the collar table of your database for all or selected holes in the database.
To run this function: Choose Database > Report > Collar summary, or Design > Blast design > Report > Collar summary, or...
Collar summary report form
Location of report file
Enter the location name for the report file that will be generated.
ID of report file
Enter the ID number for the report file that will be generated. The report file will be given a ".NOT" file extension.
Define optional collar fields
Enter the names of any of the optional fields from the collar table which are to be included in the report.
Complete the COLLAR SUMMARY REPORT form and choose Apply to display the DEFINE QUERY CONSTRAINTS form.
Complete the DEFINE QUERY CONSTRAINTS form and choose Apply to produce the collar summary report.
Once you have commenced the collar summary, all hole's that have matched the selection criteria will be output to the report file. Upon completion of processing the number of holes processed and the name of the report file will be displayed in the message window. The output from this function will be a text file containing a summary of all of the hole collar information stored in the collar table of your database that meet the specified selection criteria. Any optional collar items that are requested will also be incorporated into the report.
The report which is created will contain the following fields from the collar table:
hole_id, y, x, z, max_depth
and the following fields from the survey table:
dip, azimuth
as well as the nominated optional fields from the collar table.
================================================================================
                           DRILL HOLE COLLAR SUMMARY           Date : 10-Nov-92
================================================================================

     HOLE ID      NORTHING    EASTING     ELEVATION    DEPTH     DIP    AZIMUTH
--------------------------------------------------------------------------------

 RC001               7051.00     2349.00      153.82     72.34   -60.00    90.00
 RC002               7053.00     2401.30      153.71     62.34   -60.00    90.00
 RC003               7052.00     2450.00      153.57     56.19   -60.00    90.00
 RC004               7053.50     2502.10      153.92     42.99   -60.00    90.00
 RC005               7000.60     2349.50      154.08     86.57   -60.00    90.00
 RC006               6999.00     2399.00      155.00     71.58   -60.00    90.00
 RC007               7001.00     2452.00      154.99     59.28   -60.00    90.00
 RC008               7002.00     2501.00      155.31     43.55   -60.00    90.00
 RC009               6951.00     2350.00      153.31     76.82   -60.00    90.00
 RC010               6952.00     2402.00      154.77     74.22   -60.00    90.00
 RC011               6949.00     2451.00      156.57     66.21   -60.00    90.00
 RC012               6937.87     2492.82      157.00     54.29   -60.00    90.00
 RC013               6889.18     2345.82      153.10     75.92   -60.00    90.00
 RC014               6901.00     2398.43      154.69     73.48   -60.00    90.00
 RC015               6901.70     2450.30      156.59     66.93   -60.00    90.00
 RC016               6903.00     2498.70      156.69     48.93   -60.00    90.00
 RC017               6852.20     2349.00      153.59     73.56   -60.00    90.00
 RC018               6851.00     2402.00      154.89     72.96   -60.00    90.00
 RC019               6849.32     2450.00      156.84     70.01   -60.00    90.00
 RC020               6850.60     2499.10      156.11     52.12   -60.00    90.00
 RC021               6803.00     2350.87      154.03     72.58   -60.00    90.00
 RC022               6801.00     2401.00      155.12     71.57   -60.00    90.00
 RC023               6799.00     2451.00      157.00     50.92   -60.00    90.00
 RC024               6800.87     2502.00      155.34     40.33   -60.00    90.00
 RC025               6747.30     2350.00      154.00     66.01   -60.00    90.00
 RC026               6748.60     2400.80      154.81     61.19   -60.00    90.00
 RC027               6749.00     2452.00      155.33     42.19   -60.00    90.00
 RC028               6748.14     2501.00      154.57     30.22   -60.00    90.00

--------------------------------------------------------------------------------
|
The output from this function will be a text file which can be printed out, viewed in any text editor or word processor, or incorporated into a hard copy plot using the PLOTTING menu.
Drill Hole Listing
This function creates a simple formatted report of data for a drill hole by allowing you to define the tables and fields which are to be included on the report. Any missing fields in the tables are written as blanks in the report.
To run this function: Choose Database > Report > Drillhole listing, or...
Drill hole listing form
Define the note file for the report
Enter the Location and ID of the .not file which will be created to contain the drill hole listing report.
Define the COLLAR fields
Enter the fields from the collar table which are to be included in the report.
Define the tables
Enter the names of each of the tables, other than the collar table, which are to be included in the report.
Complete the DRILL HOLE LISTING form and choose Apply to display the DEFINE THE FIELDS FOR THE LISTING form.
This form contains a scrolling region which is a window into an area which will contain one scrolling region for each table name entered on the previous form. Each of these inner scrolling regions is titled with the name of the table for which the fields must be defined.
Enter the names of each of the fields in each of the tables and then choose Apply to display the DEFINE QUERY CONSTRAINTS form.
Complete the DEFINE QUERY CONSTRAINTS form and choose Apply to complete the function. An example of the report produced by this function is shown below.
SURPAC2                          DRILL HOLE LISTING                 Page :    1
Database : gold                                                Date : 30-Sep-94

hole_id               y          x          z  max_depth
RC002           7053.00    2401.30     153.71      62.34


Table: survey
    depth        dip    azimuth
    62.34      60.00      90.00

Table: assay
depth_from   depth_to       gold     silver
      0.00       2.00       0.09       0.08
      2.00       4.00       0.13       0.15
      4.00       6.00       0.12       0.16
      6.00       8.00       0.18       0.17
      8.00      10.00       0.19       0.19
     10.00      12.00       0.09       0.05
     12.00      14.00       0.07       0.04
     14.00      16.00       0.08       0.10
     16.00      18.00       0.07       0.09
     18.00      20.00       1.23       6.15
     20.00      22.00       3.56       7.80
     22.00      24.00       7.89       9.45
     24.00      26.00       4.56       2.80
     26.00      28.00      20.67      13.35
     28.00      30.00       2.34       1.70
     30.00      32.00       0.56       2.80

Table: geology
depth_from   depth_to  rock
      0.00       3.45  OVB
      3.45      18.67  VOL
     18.67      30.12  QV1
     30.12      44.89  VOL
     44.89      56.50  QV2
     56.50      62.34  VOL
|
Drill Hole Log
With this function you can produce a drill hole log of collar information, survey information and selected assay and geology information for selected holes in the database. Any missing fields in the samples table will be written as blanks in the report.
To run this function: Choose Database > Report > Drillhole log, or...
Drill hole log report form
Location of report file
Enter the location name for the report file that will be generated.
ID of report file
Enter the ID number for the report file that will be generated. The report file will be given a `.not' extension.
Define the report tables
Samples and Geology
Enter the names of the tables which are to be used to extract sample data and geology data fields from for the report.
Combine adjacent samples
For each table in the report you may indicate that adjacent samples which have the same value are to be combined together as if they were one sample. Enter "Y" to combine adjacent samples together otherwise enter "N" to ensure that all samples are reported.
Define optional collar fields
Enter the field names of any optional fields from the collar table which are to be included in the report.
The report will include the following fields from the collar table:
hole_id, y, x, z, max_depth
and the following fields from the survey table:
dip, azimuth
as well as any optional collar fields entered here.
Complete the DRILL HOLE LOG REPORT form and choose Apply to display the DEFINE THE SAMPLE FIELDS form. This form will be displayed to allow you to enter the field names to be included in the report for both the sample table and the geology table.
Define the sample fields form
Table
The table name from which the sample fields are to be selected is displayed here.
Field name
Enter the names of the fields which are to be included in the report.
Complete the DEFINE THE SAMPLE FIELDS form and choose Apply to display the DEFINE QUERY CONSTRAINTS form. Complete the DEFINE QUERY CONSTRAINTS form and choose Apply to begin processing of the DRILL HOLE LOG function.
The output from this function will be a text file containing details of all of the drill holes in your database that meet the specified selection criteria.
================================================================================
                                 DRILL HOLE LOG                Date : 10-Nov-92,
================================================================================

 HOLE ID : RC023

 NORTHING : 6799           EASTING  : 2451       ELEVATION : 157

 MAXDEPTH : 50.92          AZIMUTH : 90          DIP : -60


--------------------------------------------------------------------------------
     FROM       TO        GOLD      GEOLOGY
--------------------------------------------------------------------------------
        .00      6.00             OVB
        .00      2.00         .92
       2.00      4.00         .56
       4.00      6.00         .42
       6.00     14.40             VOL
       6.00      8.00         .74
       8.00     10.00         .45
      10.00     12.00         .55
      12.00     14.00         .87
      14.00     16.00        1.19
      14.40     21.00             QV1
      16.00     18.00        7.36
      18.00     20.00        3.23
      20.00     22.00         .67
      21.00     26.20             VOL
      22.00     24.00         .24
      24.00     26.00        9.48
      26.00     28.00       10.10
      26.20     38.45             QV2
      28.00     30.00        6.97
      30.00     32.00        2.19
      32.00     34.00        1.72
      34.00     36.00        5.61
      36.00     38.00        3.26
      38.00     40.00         .56
      38.45     50.92             VOL
      40.00     42.00         .54
      42.00     44.00         .25
      44.00     46.00         .07
      46.00     48.00         .03
      48.00     50.92         .01

--------------------------------------------------------------------------------
|
The output from this function will be a text file which can be printed out, viewed in any text editor or word processor, or in some cases incorporated into a hard copy plot using the PLOTTING module.
High Grade Report
With this function you can produce a report containing bulked high grade samples for selected holes in your database. The report is very useful for identifying significant assay intercepts in your drill hole database.
The resulting grades/qualities can be weighted by length alone or optionally by other fields in the table containing the sample data. This is useful if it is necessary to weight by specific gravity or recovery.
To run this function: Choose Database > Report > High grade report, or...
High grade report form
Table name
Enter the name of the table containing the sample data which will be used for defining the sample fields which are to be extracted.
Sample fields, Field name
Enter the name of each of the sample fields which are to be included in the report of the composite samples.
Weighting fields - Field Name, Default
If required, the calculation of the grades/qualities in the composite samples may be weighted by some other field/s in the sample table in addition to the length weighting which is already performed.
Typically, additional weighting fields used would be specific gravity and/or recovery. A maximum of 5 additional weighting fields may be used. Enter the field name/s which are to be used to provide the additional weighting criteria for the creation of the composite intervals.
Under some circumstances it is likely that no values may be available for the weighting field for some samples. The Default input field permits a reasonable default value to be defined to cover this circumstance.
The default value is used in preference to the stored value in the table when either a NULL value is present or when the value present is less than zero.
Minimum grade
Enter the minimum acceptable grade to be used for creating the composite intervals. This value is used for the first field defined in the Fields to be composited input region.
Minimum composite width
Enter the minimum width of the composites that will be reported.
Maximum internal dilution
Enter the maximum width of intervening low-grade material that will be included in the high grade composite.
Use true thickness
The Minimum composite width and Maximum internal dilution parameters and the length calculations performed on the raw sample data to create the composite sample intervals can done either as apparent or true widths. If the checkbox is unticked all values are considered as apparent widths. If the checkbox is ticked all values are considered to be true widths.
If you tick the checkbox to perform true width calculations the Calculate True Thickness form will be displayed to define the method of determining the dip and dip direction for the mineralised zone.
True thickness calculations can be complex to understand because of the different factors that are considered when performing the calculation. The method used to calculate the true thickness is:
- For each sample obtained from the interval table for which the composites are being calculated the true width of the sample is calculated by using the dip and direction of the borehole trace AND the dip and dip direction of the mineralised zone at the mid point of the sample.
- The true width value for individual samples, and for the gaps in sampling, are added together and compared with the minimum width and maximum dilution values entered. Thus these control parameters are interpreted as being true width values.
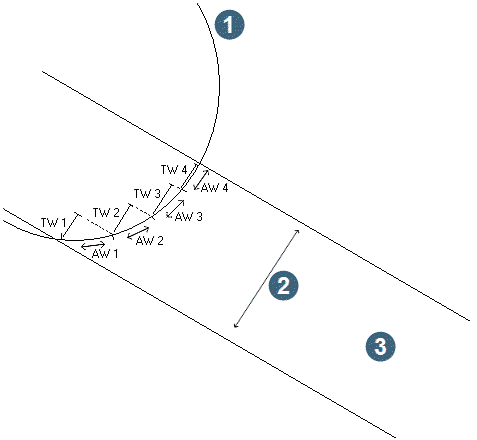
Calculating true widths for individual samples and adding them together gives results that become progressively less accurate as the variation of the dip and azimuth of the drillhole and the dip and dip direction of the mineralised zone increase over the length of the composite interval that is created. The most likely outcome of this is that the true width reported for the composite interval may be greater than what you might expect it to be. The diagram below which has extreme, and completely unrealistic, curvature demonstrates this quite clearly. To be confident that the results are meaningful for your circumstances you should examine the variation of the borehole path and the orientation of the mineralised zone to ensure that the variations are not so extreme that the results will be meaningless.
|
1. drill hole collar 2. true width 3. mineralised zone |
In the diagram above there are 4 samples in the mineralised zone with the apparent width of the samples denoted as AW1, AW2, AW3 and AW4. Each of these samples has a true width, nominally TW1, TW2, TW3 and TW4. Under certain circumstances, where significant variation in the angle between the orebody dip and drillhole orientation exists, the sum of the true widths for the samples of interest may be greater than the true width of the zone of interest. It is this geometric peculiarity that you must be alert for.
Break on blank or negative master assay?
The valid entries are:
- Y, causes a break in the composite if a blank (missing) or negative master assay is encountered.
- N, the master assay is treated as described below.
Dilute blank or negative samples
The valid entries are:
- Y, blank (missing) or negative samples are diluted as if equal to zero.
- N, blank (missing) intervals and intervals with a negative assay are ignored in the calculation of composite values.
Select by hole depth? (Y/N)
Enter `Y' if you wish to selectively extract samples based on hole depth. If you enter 'Y' then you must enter the upper and lower limiting depths to be used for all holes at the Upperand Lower prompts on this form.
Define the zone selection method
You can restrict the bulking of grades to be within particular geological zones by choosing one of the following:
- NO SELECTION, do not select by geology.
- MULTIPLE ZONES, define the zone by entering one or more geology codes.
- ZONE FROM TO, define the zone as being from the top or bottom of one geology code to the top or bottom of another.
Define the report file to create
Enter the Report file name and Formatthat will be created.
Complete the High Grade Report form and choose Apply. If the Use true thickness checkbox has been ticked the Calculate True thickness form will be displayed to define the true thickness parameters.
Two different methods of defining the dip and dip direction of the mineralised zone may be used. These are:
- By using average values for the dip and dip direction. You would use average values when the dip and dip direction are reasonable consistent over the area of interest or when the dip and dip direction are only approximate and you want an approximate idea of the true thickness. When using this method you must enter the dip and dip direction in decimal degrees.
- By using values for the dip and dip direction defined by a number of closed segments where the region inside each closed segment defined a specific dip and dip direction.
In this way you can model some variation in orebody dip.
This method requires you to define the dip string file(s) which may contain any number of strings, each of which have any number of segments. Each segment of each string must have the dip angle in the D1 field, and the dip bearing in the D2 field. Error angles must be in D3 and D4. The dip and dip direction values must be specified in decimal degrees. When a zone is identified and its northing and easting computed, the dip strings are examined to find the segment containing the point. The angles supplied with that string are then used in the true thickness calculation. The extent of these strings must be large enough to include all drill holes.
The error values may be ignored as they are not used in calculating the result at this time.
Depending on the zone selection method you chose at the Define the zone selection method prompt (Multiple zones or Zone from to), one of two forms is displayed to permit you to define the geological selection criteria.
Complete the zone selection forms and choose Applyto display the SELECT CONSTRAINTS FOR FIELDS form.
Complete the SELECT CONSTRAINTS FOR FIELDS form and choose Apply to produce the high grade report.
Messages
Once you have commenced the high grade report, the number of holes processed to create the report file will be displayed in the message window. Upon completion of processing the name of the report file will be displayed in the message window.
Result
The output from this function will be a text file containing details of all of the high grade intercepts in drill holes that meet the specified selection criteria.
===================================================================================
 SURPAC                HIGH GRADE REPORT                                 10-Jan-97
===================================================================================

 Minimum Composite Width   : 5.00
 Maximum Internal Dilution : 2.00
 Cutoff Criteria --> Field : gold                  Minimum Grade : 3.000
 Weighted by             : spare1

-----------------------------------------------------------------------------------

 HOLE ID             FROM       TO      LENGTH    GOLD       SILVER    Tot. Wgt.
-----------------------------------------------------------------------------------

 RC001               48.00     56.00      8.00      7.1028      5.5141    710.0000
 RC002               20.00     28.00      8.00     14.2576     10.6609     73.3600
 RC002               48.00     56.00      8.00      6.7622      7.2399     47.3600
 RC003               32.00     42.00     10.00      6.0544      2.4865     52.9200
 RC006               28.00     38.00     10.00     15.2718      6.3686    125.5000
 RC007               10.00     18.00      8.00     10.4088      4.3210     65.8600
 RC007               32.00     46.00     14.00      8.3234      6.0456    105.8600
 RC008               14.00     28.00     14.00     10.6134      5.8591    128.5800
 RC010               34.00     52.00     18.00     12.1932     60.9662    167.0200
 RC011               18.00     24.00      6.00      6.9804     31.4162     36.8800
 RC011               38.00     48.00     10.00     14.3505     64.5791     64.4200
 RC012               18.00     28.00     10.00      7.2747     32.7391     60.0400
 RC014               48.00     54.00      6.00      4.0033     18.0162     22.1800
 RC015               40.00     52.00     12.00      8.1552     44.8575     82.4200
 RC016               10.00     30.00     20.00      7.9752     35.8918    122.1000
 RC018               36.00     46.00     10.00      8.6790     43.3950     76.0400
 RC019               12.00     18.00      6.00      9.0386     31.6382     41.7800
 RC019               38.00     48.00     10.00      9.6830     33.8945     81.8200
 RC020                4.00     26.00     22.00      6.3097     28.3951    108.0000
 RC022               28.00     44.00     16.00      8.8063     30.8229    112.5400
 RC023               24.00     30.00      6.00      9.0569     36.2277     53.1000
 RC025               48.00     56.00      8.00      7.8406     25.8731     53.2200
 RC026               20.00     26.00      6.00      6.8003     24.4819     36.6600

-----------------------------------------------------------------------------------
|
The output from this function will be a text file which can be printed out, viewed in any text editor or word processor, or incorporated into a hard copy plot using the PLOTTING module.
View Drill Hole
This function allows you to display some or all data for a drill hole on a single data entry form. You must first define which tables in the database are to be included for viewing and also which fields in each of these tables are to be included for viewing. Any missing fields in the tables are written as blanks in the form.
To run this function: Choose Database > Report > Drillhole data, or Design > Blast design > Report > Drillhole data, or...
View drill hole form
Hole ID
Enter the identifier for the drill hole which is to be viewed.
Note: Hole_id's are case sensitive.
Define the collar fields
Enter the names of each of the fields in the collar table which are to be included for viewing.
Define the tables
Enter the names of each of the tables, other than the collar table, which are to be included for viewing.
Complete the VIEW DRILL HOLE form and choose Apply to display the DEFINE THE FIELDS FOR THE TABLES form.
This form contains a scrolling region which is a window into an area which will contains one scrolling region for each table name entered on the previous form. Each of these inner scrolling regions is titled with the name of the table for which the fields must be defined.
Enter the names of each of the fields in each of the tables and then choose Apply to display the VIEW DRILL HOLE DATA form.
The VIEW DRILL HOLE DATA form contains a scrolling region which is a window into an area which contains one scrolling region for each table name entered on the VIEW DRILL HOLE form plus a scrolling region for the collar table data. Each of these inner scrolling regions is titled with a table name and field names. Use the scroll bars to view the data which is displayed on this data entry form.
Choose Apply or Cancel when you have finished viewing the data.