


Composite downhole
With this function you can create a string file of composite samples based on composite lengths down a drill hole. The resulting composites are downhole composites of equal length. You can use the string as input for statistical and geostatistical studies, or for plotting.
You can weight the resulting grades or qualities by length alone or optionally by other fields in the table containing the sample data. This is useful if it is necessary to weight by specific gravity or recovery.
Prerequisites: A drillhole database is open.
To run this function: Choose Database > Composite > Downhole, or...
The compositing progresses while the master sample value is greater or equal to zero and samples adjoin. The negative value is considered to have special meaning (for example, a missing sample). See Translation Table.
If a master grade smaller than zero is found, the sample is treated as missing and discarded. If any other sample is found to be less than zero, its value and sample length are not added to its composite. That is, the composite grade for this sample is calculated over the partial compositing interval. The short composite intervals, preceding a gap between samples, missing sample, or EOH are saved if they are equal or greater than the nominated minimum percentage of composite interval, but they are written to the string+1 (for example, if string is 1, they are written to string 2).
Fields on the Composite downhole form.
| Field | Description |
|---|---|
| Define the string file to create | |
| Output composites | The name of the Location. |
| New string | The ID number of the string that you wish to generate. |
| Composite length | The length of the composites that you wish to generate. Select the unit of length. |
| Determine composite length by |
|
| Minimum % of sample to be included | The minimum percentage of the composite length for which samples must be present. Any composites with less than this amount of sample data available will be written to the nominated string+1 (e.g. if nominated string is 1, composites with less than this amount will be written to string 2). |
| Define the zone selection method |
Restriction of the bulking of grades to be within particular geological zones. Options are:
|
| Dilute negative samples |
|
| Table name | The name of the table containing the sample data to be used for defining the sample fields which are to be extracted. An example Table name is sample. |
| Fields to be composited | |
| Field Name | The name of each of the sample fields to be included in the geometry file containing the composite samples. An example Field name is gold. |
| Optional weighting fields | |
| Field Name |
The field name or names to be used to provide the additional weighting criteria for the creation of the composite intervals.
|
| Default | The default value to use when no values are available for the weight field for some samples. The default value is used in preference to the stored value in the table when either a null value is present or when the value present is less than zero. |
| Include Limit |
The value for each weighting field to determine if a composite sample provides sufficient support for subsequent geostatistical evaluation. If a weighting field of recovery (%) is used, an appropriate cutoff value might be 90%. This is then used with the Minimum % of sample length to determine if a composite sample is Short or not.
|
 more detail about best fit
 Note: If required, the calculation of the grades/qualities in the composite samples may be weighted by some other field/s in the sample table in addition to the length weighting which is already performed.
Typically, additional weighting fields used would be specific gravity and/or recovery. A maximum of 5 additional weighting fields may be used.
Note: If required, the calculation of the grades/qualities in the composite samples may be weighted by some other field/s in the sample table in addition to the length weighting which is already performed.
Typically, additional weighting fields used would be specific gravity and/or recovery. A maximum of 5 additional weighting fields may be used.When you click Apply, additional forms might be displayed.
Depending on the zone selection method you chose at the Define the zone selection method prompt (Multiple zones or Zone from to), one of two forms is displayed to permit you to define the geological selection criteria.
Complete the zone selection forms and choose Apply to display the DEFINE QUERY CONSTRAINTS form.
Complete the SELECT CONSTRAINTS FOR FIELDS form and choose Apply to begin the compositing process. All holes that meet the selection criteria and which have composites formed are listed in the Message window. The name of the file that will store the results is also displayed in the Message window.
Messages
The name of the output string file which is created , and the number of holes which have been processed, are displayed in the Message window.
Output
The output from COMPOSITE DOWNHOLE is a single string file. This file contains the following information:
| Field | Contents |
|---|---|
| Y, X, Z | The Y, X, Z coordinates of the middle of each composite interval. |
| D1 | The composited grade for the first specified sample field. The second and subsequent description fields will contain the composite grades for the second and subsequent sample fields if more than one sample field is extracted. |
| D2 | Hole id If only one sample field is extracted the hole_id will be in D2. The hole_id will always be found in the field after the composited grade. |
| D3 | Depth from. If only one sample field is extracted the depth_from will be in D3. The depth_from value will always be found in the field after the hole_id field. |
| D4 | Depth to If only one sample field is extracted the depth_to will be in D4. The depth_to value will always be found in the field after the depth_from field. |
| D5 | If only one sample field is extracted the total weight will be in D5. The total weight will always be found in the field after the depth_to field. This field will contain the total weighting value of all samples used in the composite. If weighting by specific gravity, dividing this value by the composite length will give the length weighted specific gravity. The total weight field will always be found in the field after the depth_to field. |
| D6 | If only one sample field is extracted the total length will be in D6. This field will contain the total geology length making up the composite. The total length will always be found in the field after the total weight field. |
The New string number contains those composites that had at least the minimum percentage of samples available for compositing. The string that has a string number of <New string number> + 1 contains those composites that had less than the minimum percentage of assays available for compositing.
Examples
Downhole Compositing Example #1
Given the following data:
|
depth_from |
depth_to |
gold |
|
0 |
1 |
1 |
|
1 |
2.5 |
2 |
|
2.5 |
5 |
3 |
|
5 |
9 |
4 |
|
9 |
12 |
5 |
|
12 |
13 |
-1 |
|
13 |
15 |
7 |
And setting:
Composite length: 2
Minimum percentage: 75
Dilute negative samples: N
Optional Weighting Fields: (none)
Surpac will create the following composite values as output. The following image shows the following values from left to right: string number, composite value, depth, and sample value.
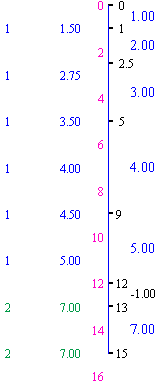
The output string numbers for each composite are based on the value specified for "Minimum % of sample to be included". The string number specified (string 1 in this example) is used only where the composite contains an amount of contained interval greater than or equal to the "Minimum % of sample to be included".
Given the data:
Starting string number: 1
Minimum percentage: 75
Optional Weighting Fields: (none)
The string classification will be as follows:
|
String |
% of sample present |
|
1 |
>= 75 |
|
2 |
0 > value < 75 |
|
not created |
0 |
Below is a detailed explanation of the calculation of the composite values and the string assignment for each composite interval:
Composite from 0 to 2:
|
Depth_from |
Depth_to |
Sample Value x Interval Proportion |
Weighted Value |
|
0 |
1 |
1 x (1/2) |
0.5 |
|
1 |
2 |
2 x (1/2) |
1.0 |
|
Weighted Composite Value: |
1.5 |
The composite is classified to string 1 since 100% of the composite interval is represented, which is greater than the value of Minimum % of sample to be included (75%).
Composite from 2 to 4:
|
Depth_from |
Depth_to |
Sample Value x Interval Proportion |
Weighted Value |
|
2 |
2.5 |
2 x (0.5/2) |
0.50 |
|
2.5 |
4 |
3 x (1.5/2) |
2.25 |
|
Weighted Composite Value: |
2.75 |
The composite is classified to string 1 since 100% of the composite interval is represented, which is greater than the value of Minimum % of sample to be included (75%).
Composite from 4 to 6:
|
Depth_from |
Depth_to |
Sample Value x Interval Proportion |
Weighted Value |
|
4 |
5 |
3 x (1/2) |
1.5 |
|
5 |
6 |
4 x (1/2) |
2.0 |
|
Weighted Composite Value: |
3.5 |
The composite is classified to string 1 since 100% of the composite interval is represented, which is greater than the value of Minimum % of sample to be included (75%).
Composite from 6 to 8:
|
Depth_from |
Depth_to |
Sample Value x Interval Proportion |
Weighted Value |
|
6 |
8 |
4 x (2/2) |
4.0 |
|
Weighted Composite Value: |
4.0 |
The composite is classified to string 1 since 100% of the composite interval is represented, which is greater than the value of Minimum % of sample to be included (75%).
Composite from 8 to 10:
|
Depth_from |
Depth_to |
Sample Value x Interval Proportion |
Weighted Value |
|
8 |
9 |
4 x (1/2) |
2.0 |
|
9 |
10 |
5 x (1/2) |
2.5 |
|
Weighted Composite Value: |
4.5 |
The composite is classified to string 1 since 100% of the composite interval is represented, which is greater than the value of Minimum % of sample to be included (75%).
Composite from 10 to 12:
|
Depth_from |
Depth_to |
Sample Value x Interval Proportion |
Weighted Value |
|
10 |
12 |
5 x (2/2) |
5.0 |
|
Weighted Composite Value: |
5.0 |
The composite is classified to string 1 since 100% of the composite interval is represented, which is greater than the value of Minimum % of sample to be included (75%).
Composite from 12 to 14:
Since Dilute negative samples was set to N, the missing interval from 12 to 13 (gold = -1) is not included in the calculation. If Dilute negative samples would have been set to Y, the interval from 12 to 13 would have been included, and the sample value would have been 0 (zero).
|
Depth_from |
Depth_to |
Sample Value x Interval Proportion |
Weighted Value |
|
12 |
13 |
-1 x 0 |
0 |
|
13 |
14 |
7 x (1/1) |
7.0 |
|
Weighted Composite Value: |
7.0 |
The composite is classified to string 2 since there was only 50% of the composite length present, which is less than the value of Minimum % of sample to be included (75%).
Composite from 14 to 16:
Since the end of the hole is 15, the missing interval from 15 to 16 is not included in the calculation, regardless of whether "Dilute negative samples" is set to Y or N.
|
Depth_from |
Depth_to |
Sample Value x Interval Proportion |
Weighted Value |
|
14 |
15 |
7 x (1/1) |
7.0 |
|
15 |
16 |
interval not included in calculation |
0 |
|
Weighted Composite Value: |
7.0 |
The composite is classified to string 2 since there was only 50% of the composite length present, which is less than the value of Minimum % of sample to be included (75%).
Downhole Compositing Example #2
Given the following data:
|
depth_from |
depth_to |
gold |
recovery |
sg |
|
0 |
1 |
1 |
50 |
1 |
|
1 |
2.5 |
2 |
||
|
2.5 |
5 |
3 |
20 |
3 |
|
5 |
9 |
4 |
100 |
2 |
|
9 |
12 |
5 |
60 |
2 |
|
12 |
13 |
-1 |
-1 |
-1 |
|
13 |
15 |
7 |
100 |
2 |
And setting:
Composite length: 2
Minimum percentage: 75
Dilute negative samples: N
Optional Weighting Fields:
|
FIELD NAME |
DEFAULT |
INCLUDE LIMIT |
|
recovery |
100 |
80 |
|
sg |
1 |
The following composite values will result:
Surpac will create the following composite values as output. The following image shows the following values from left to right: string number, composite value, depth, sample value, recovery, and specific gravity (that is, density).
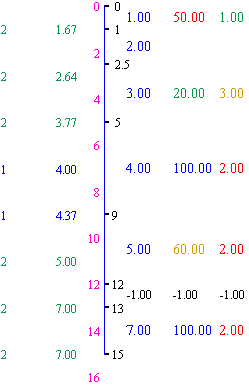
The output string numbers for each composite are based on the value specified for "Minimum % of sample to be included", and "Include Limit". The string number specified (string 1 in this example) is used where the composite contains an amount of contained interval greater than or equal to the "Minimum % of sample to be included", AND contains a length weighted average value of each of the "Optional weighting fields" greater than or equal to the "Include limit" for EACH include limit specified.
Given the data:
Starting string number: 1
Minimum percentage: 75
Optional Weighting Fields:
|
FIELD NAME |
DEFAULT |
INCLUDE LIMIT |
|
recovery |
100 |
80 |
|
sg |
1 |
The string classification will be as follows:
|
String |
% of sample present |
Recovery |
|
1 |
>= 75 |
>= 80 |
|
2 |
< 75 |
any value |
|
2 |
any value > 0 |
< 80 |
|
not created |
0 |
any value |
Below is a detailed explanation of the calculation of the composite values and the string assignment for each composite interval:
Composite from 0 to 2:
Since Recovery and SG are blank for the interval from 1 to 2.5, the "default values" of 100 for Recovery and 1.00 for SG are used.
|
Depth_from |
Depth_to |
Sample Interval x Recovery x SG |
Weight Value |
|
0 |
1 |
1 x 50 x 1 |
50 |
|
1 |
2 |
1 x 100 x 1 |
100 |
|
Total: |
150 |
|
Depth_from |
Depth_to |
Sample Value x Weight Proportion |
Weighted Value |
|
0 |
1 |
1 x (50/150) |
0.333 |
|
1 |
2 |
2 x (100/150) |
1.333 |
|
Weighted Composite Value: |
1.666 |
Length Weighted Average Recovery
|
Depth_from |
Depth_to |
Recovery x Sample Interval Proportion |
Weighted Value |
|
0 |
1 |
50 x (1/2) |
25 |
|
1 |
2 |
100 x (1/2) |
50 |
|
Average Recovery: |
75 |
Although 100% of the sample interval is represented, the composite is classified to string 2 because the Average Recovery is 75%, which is less than the Include Limit value of 80%.
Composite from 2 to 4:
Since Recovery and SG are blank for the interval from 1 to 2.5, the "default values" of 100 for Recovery and 1.00 for SG are used.
|
Depth_from |
Depth_to |
Sample Interval x Recovery x SG |
Weight Value |
|
2 |
2.5 |
0.5 x 100 x 1 |
50 |
|
2.5 |
4 |
1.5 x 20 x 3 |
90 |
|
Total: |
140 |
|
Depth_from |
Depth_to |
Sample Value x Weight Proportion |
Weighted Value |
|
2 |
2.5 |
2 x (50/140) |
0.714 |
|
2.5 |
4 |
3 x (90/140) |
1.929 |
|
Weighted Composite Value: |
2.643 |
Length Weighted Average Recovery
|
Depth_from |
Depth_to |
Recovery x Sample Interval Proportion |
Weighted Value |
|
2 |
2.5 |
100 x (0.5/2) |
25 |
|
2.5 |
4 |
20 x (1.5/2) |
15 |
|
Average Recovery: |
40 |
Although 100% of the sample interval is represented, the composite is classified to string 2 because the Average Recovery is 40%, which is less than the Include Limit value of 80%.
Composite from 4 to 6:
|
Depth_from |
Depth_to |
Sample Interval x Recovery x SG |
Weight Value |
|
4 |
5 |
1 x 20 x 3 |
60 |
|
5 |
6 |
1 x 100 x 2 |
200 |
|
Total: |
260 |
|
Depth_from |
Depth_to |
Sample Value x Weight Proportion |
Weighted Value |
|
4 |
5 |
3 x (60/260) |
0.692 |
|
5 |
6 |
4 x (200/260) |
3.077 |
|
Weighted Composite Value: |
3.769 |
Length Weighted Average Recovery
|
Depth_from |
Depth_to |
Recovery x Sample Interval Proportion |
Weighted Value |
|
4 |
5 |
20 x (1/2) |
10 |
|
5 |
6 |
100 x (1/2) |
50 |
|
Average Recovery: |
60 |
Although 100% of the sample interval is represented, the composite is classified to string 2 because the Average Recovery is 60%, which is less than the Include Limit value of 80%.
Composite from 6 to 8:
|
Depth_from |
Depth_to |
Sample Interval x Recovery x SG |
Weight Value |
|
6 |
8 |
2 x 100 x 2 |
200 |
|
Total: |
200 |
|
Depth_from |
Depth_to |
Sample Value x Weight Proportion |
Weighted Value |
|
6 |
8 |
4 x (200/200) |
4.000 |
|
Weighted Composite Value: |
4.000 |
Length Weighted Average Recovery
|
Depth_from |
Depth_to |
Recovery x Sample Interval Proportion |
Weighted Value |
|
6 |
8 |
100 x (2/2) |
100 |
|
Average Recovery: |
100 |
Since 100% of the sample interval is represented, and the Recovery is 100% (greater than the Include Limit value of 80%), the composite is classified to string 1.
Composite from 8 to 10:
|
Depth_from |
Depth_to |
Sample Interval x Recovery x SG |
Weight Value |
|
8 |
9 |
1 x 100 x 2 |
200 |
|
9 |
10 |
1 x 60 x 2 |
120 |
|
Total: |
320 |
|
Depth_from |
Depth_to |
Sample Value x Weight Proportion |
Weighted Value |
|
8 |
9 |
4 x (200/320) |
2.500 |
|
9 |
10 |
5 x (120/320) |
1.875 |
|
Weighted Composite Value: |
4.375 |
Length Weighted Average Recovery
|
Depth_from |
Depth_to |
Recovery x Sample Interval Proportion |
Weighted Value |
|
8 |
9 |
100 x (1/2) |
50 |
|
9 |
10 |
60 x (1/2) |
30 |
|
Average Recovery: |
80 |
Since 100% of the sample interval is represented, and the Average Recovery is 80% (exactly equal to the Include Limit value of 80%), the composite is classified to string 1.
Composite from 10 to 12:
|
Depth_from |
Depth_to |
Sample Interval x Recovery x SG |
Weight Value |
|
10 |
12 |
2 x 100 x 2 |
200 |
|
Total: |
200 |
|
Depth_from |
Depth_to |
Sample Value x Weight Proportion |
Weighted Value |
|
10 |
12 |
5 x (200/200) |
5.000 |
|
Weighted Composite Value: |
5.000 |
Length Weighted Average Recovery
|
Depth_from |
Depth_to |
Recovery x Sample Interval Proportion |
Weighted Value |
|
10 |
12 |
60 x (2/2) |
60 |
|
Average Recovery: |
60 |
Although 100% of the sample interval is represented, the composite is classified to string 2 because the average Recovery is 60%, which is less than the Include Limit value of 80%.
Composite from 12 to 14:
Since Dilute negative samples was set to N, the missing interval from 12 to 13 (gold = -1) is not included in the calculation. If Dilute negative samples would have been set to Y, the interval from 12 to 13 would have been included, and the sample value would have been 0 (zero).
Since Recovery = -1 and SG = -1 for the interval from 12 to 13, the "default values" of 100 for Recovery and 1.00 for SG are used.
|
Depth_from |
Depth_to |
Sample Interval x Recovery x SG |
Weight Value |
|
12 |
13 |
0 x 100 x 1 |
0 |
|
13 |
14 |
1 x 100 x 2 |
200 |
|
Total: |
200 |
|
Depth_from |
Depth_to |
Sample Value x Weight Proportion |
Weighted Value |
|
12 |
13 |
-1 x (0/200) |
0.000 |
|
13 |
14 |
7 x (200/200) |
7.000 |
|
Weighted Composite Value: |
7.000 |
Length Weighted Average Recovery
|
Depth_from |
Depth_to |
Recovery x Sample Interval Proportion |
Weighted Value |
|
12 |
13 |
100 x (1/2) |
50 |
|
13 |
14 |
100 x (1/2) |
50 |
|
Average Recovery: |
100 |
In the calculation of the Average Recovery, the value of 1 for Recovery in the interval 12 to 13 is replaced by a value of 100, as specified in the Default field of the optional weighting fields.
Although the Average Recovery value was 100, the composite is classified to string 2 since there was only 50% of the composite length present, and the "Minimum % of sample to be included" was specified as 75%.
Composite from 14 to 16:
Since the end of the hole is 15, the missing interval from 15 to 16 is not included in the calculation, regardless of whether "Dilute negative samples" is set to Y or N.
|
Depth_from |
Depth_to |
Sample Interval x Recovery x SG |
Weight Value |
|
14 |
15 |
1 x 100 x 2 |
200 |
|
15 |
16 |
interval not included in calculation |
0 |
|
Total: |
200 |
|
Depth_from |
Depth_to |
Sample Value x Weight Proportion |
Weighted Value |
|
14 |
15 |
7 x (200/200) |
7.000 |
|
15 |
16 |
interval not included in calculation |
0.000 |
|
Weighted Composite Value: |
7.000 |
Length Weighted Average Recovery
|
Depth_from |
Depth_to |
Recovery x Sample Interval Proportion |
Weighted Value |
|
14 |
15 |
100 x (1/2) |
50 |
|
15 |
16 |
100 x (1/2) |
50 |
|
Average Recovery: |
100 |
In the calculation of the Average Recovery, the missing value for Recovery in the interval 15 to 16 is replaced by a value of 100, as specified in the Default field of the optional weighting fields.
Although the Average Recovery value was 100, the composite is classified to string 2 since there was only 50% of the composite length present, and the "Minimum % of sample to be included" was specified as 75%.
Downhole Compositing Example #3
Given the following data:
|
depth_from |
depth_to |
|
0 |
9 |
|
9 |
14 |
And setting:
Composite length: 2
Minimum percentage: 75
Dilute negative samples: N
Optional Weighting Fields: (none)
Determine composite length by: best fit
Define the zone selection method: MULTIPLE ZONES (and on the Define the geology zones form, table: geology, field: rock, specification: QV1)
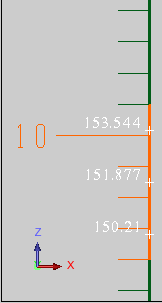
Surpac creates three composite points within each QV1 zone, spaced apart as close as possible to the Composite length of 2. The following image shows the QV1 zone in orange, and the three composite points with their Z values displayed in white. The distance between the points is 1.666 instead of 2. If Surpac had created two points, the distance between them would have been 2.5 (the zone width of 5 divided by the number of points 2). Comparing 2.5 and 1.666, 1.666 is closer to the Composite length of 2, so Surpac created three points.
Further Processing
You can use the resulting file to produce plots of the composited data, either in Graphics, or as hard copy plots. You could also use the string file as input for resource estimation using geostatistics, because it represents downhole composite data of equal length.