Task: Creating an arrow symbol in DraftSight
You can use DraftSight to create a symbol to use as mark-up on a plot.
- In Surpac, reset Graphics.
- Drag section_with_plan.dwf into Graphics.
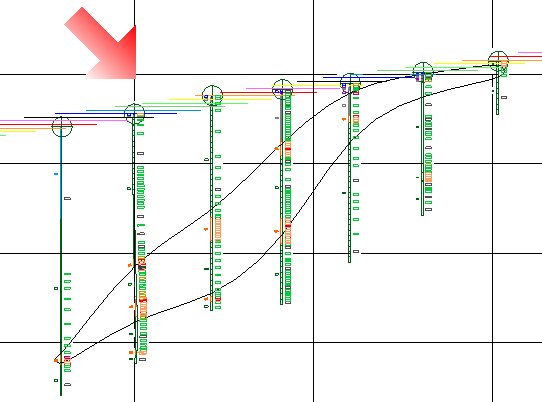
- The section plot is displayed in DraftSight.
- Click the Save icon on the toolbar and save the file as section_with_plan.dwg.
- Click Layers Manager.
- Click New, type
markup, and click Activate to create and activate a new layer calledmarkup. - Click OK.
- In the command window, type
SNAP, and press ENTER. - Type
0.2, and press ENTER to set the spacing of the snap grid. - Click Grid, in the lower part of the DraftSight window, to select it.
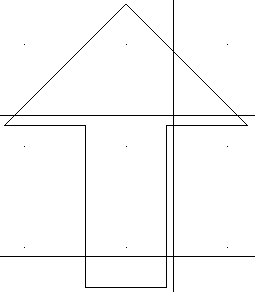
- Choose Draw > Polyline to start creating the arrow.
- Click several times to create the shape of an arrow.
- To make the final point join the first point, right-click and choose Close.
- Select the arrow, and choose Draw > Hatch/Fill.
- Fill in the Hatch/Fill form as shown.
- Click Specify entities, and click OK.
- Select the red arrow, and choose File > Export > Export Drawing.
- Fill in the Save File form as shown below, and click OK.
- Select the red hatch on the plot, and press DELETE.
- Select the underlying arrow polyline on the plot, and press DELETE.
- Choose Insert > Reference Drawing and insert arrow.dwg.
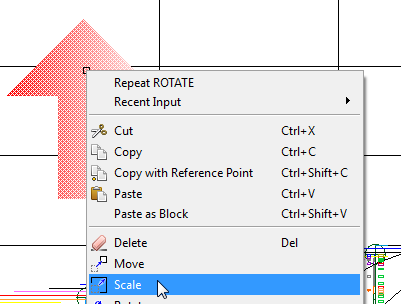
- Select the arrow, right-click, and choose Scale.
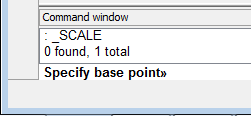
- At the prompt to specify a base point, click at the bottom of the arrow.
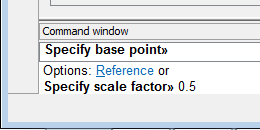
- At the prompt to specify a scale factor, type
0.5, and press ENTER. - Select the red arrow, right-click, and choose Rotate.
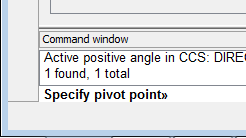
- At the prompt to select a pivot point, select the lower right corner of the arrow.
- At the prompt to specify a rotation angle, type
225, and press ENTER.
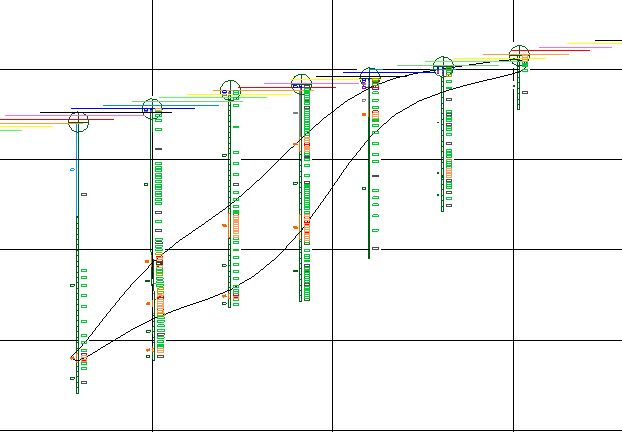
The .dwg format is useful because it is readable by more applications than the .dwf format. The .dwg format is also more portable than .dwf because the .dwg stores references to external images rather than storing the images within the .dwf file.
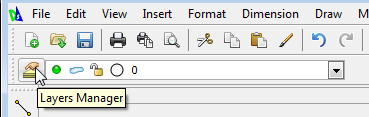
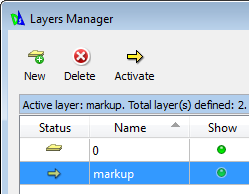
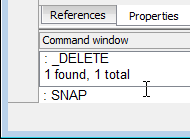
You can run most Draftsight commands from both the menu and the command window.
When you run SNAP from the command window, you can set the spacing of a grid. You can use this grid to help you create the point of the arrow with precision.
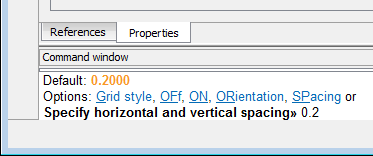
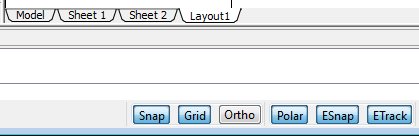
It does not matter where on the plot you create the arrow. You can move it, rotate it, or scale it, later if necessary.
The points you create snap to an invisible grid.
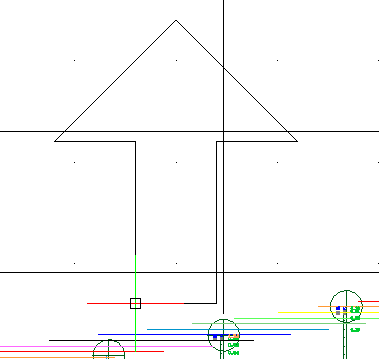
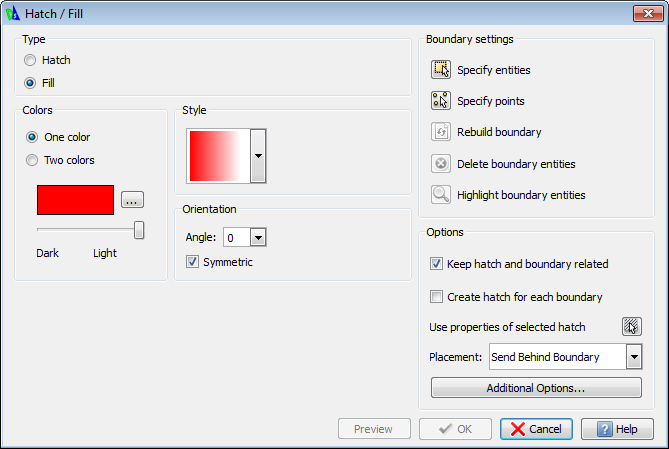
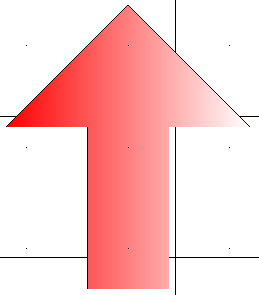
The arrow is coloured red.
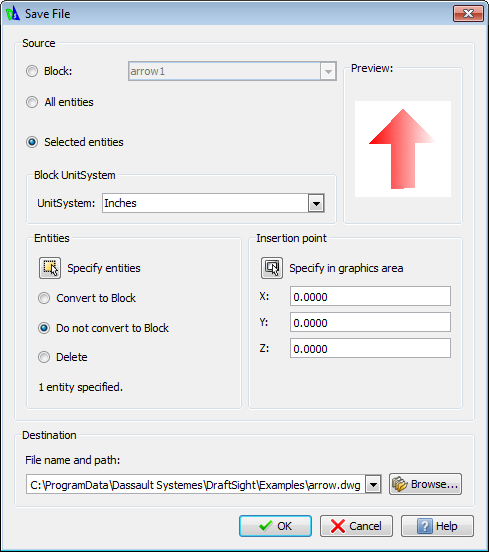
The arrow is now an object you can reuse in other plots.
Because the arrow is too large for this plot, next you will reduce its size using the Scale command.
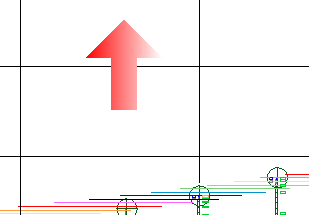
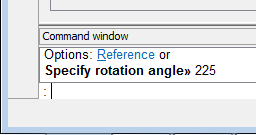
The arrow is rotated 225 degrees in an anti-clockwise direction.