


More Surpac functions
Drillhole database
You can display drillhole data, stored in a database, in any orientation such as plan or section view.
Task: Open a database, display drill hole data, and create sections
- Click Reset graphics
 .
. - Open surpac.ddb in Graphics.
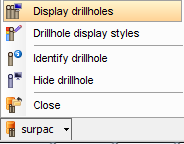
- Click the surpac database icon on the Status bar and select Display drillholes.
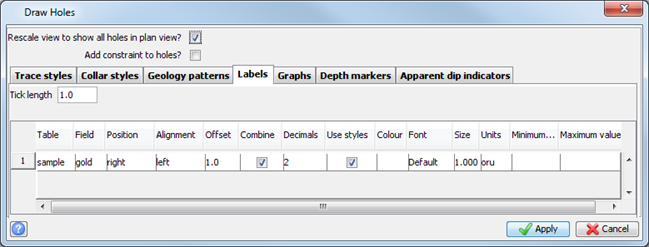
- Enter the information as shown, and click Apply.
- Choose Display > Dynamic 2D grid .
- Choose View > Zoom > In, or use the scroll wheel on your mouse to zoom in.
- Choose Database > Sections > Define.
- Enter the information as shown, and click Apply.
- Use the scroll wheel on your mouse to zoom in to a drillhole as shown below.
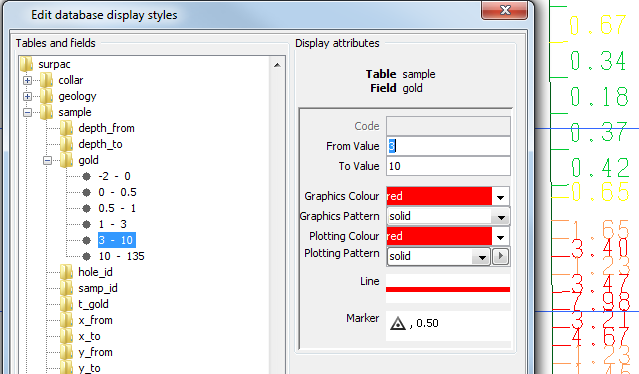
- Click the surpac database icon at the bottom of the screen, and then click Drillhole display styles.
- Expand the sample tree and the gold field to see the display attributes for gold.
When a database is open, the name of the database is displayed on the Status bar at the bottom of the Surpac window.

 Note: surpac.ddb connects to the MS Access database
surpac.accdb.
Note: surpac.ddb connects to the MS Access database
surpac.accdb.
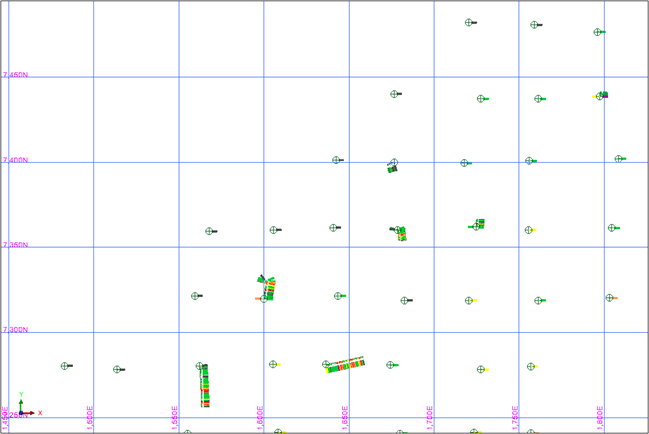
Note: The drill holes and gold values are displayed.
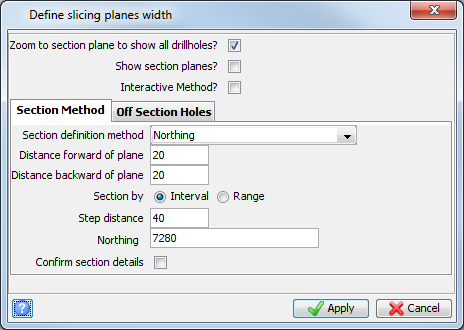
The drillholes on section 7280 North are displayed.
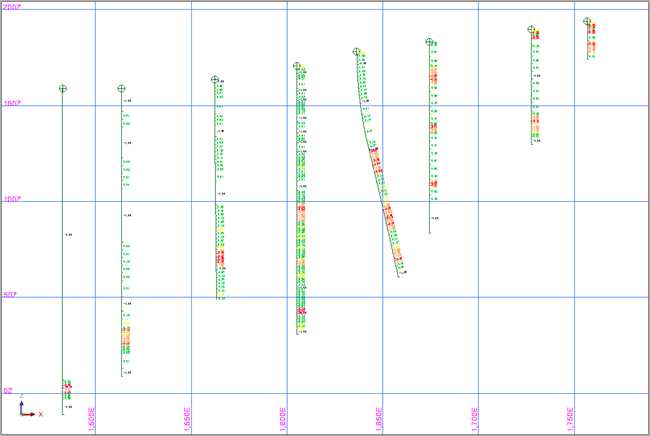
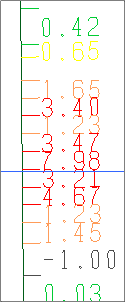
Different sample values are displayed using different colours. These colours are controlled by a styles table in the database.
Note: To see all of the steps performed in this task,
run 06a_display_drillholes_and_create_sections.tcl.
You need to click Apply on any forms presented.
Block models
A block model contains three dimensional spatial data. For example, specific gravity, rock type, and estimated sample values.
Task: Display, constrain, and report a block model
- Click Reset graphics .
- Open block_model.mdl in Graphics.
- Click the block_model icon, and select Display.
- Enter the information as shown, and click Apply.
- Click the block_model icon, and select New constraint.
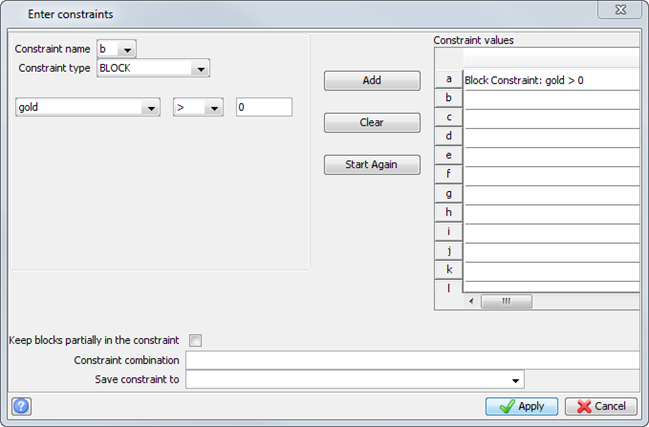
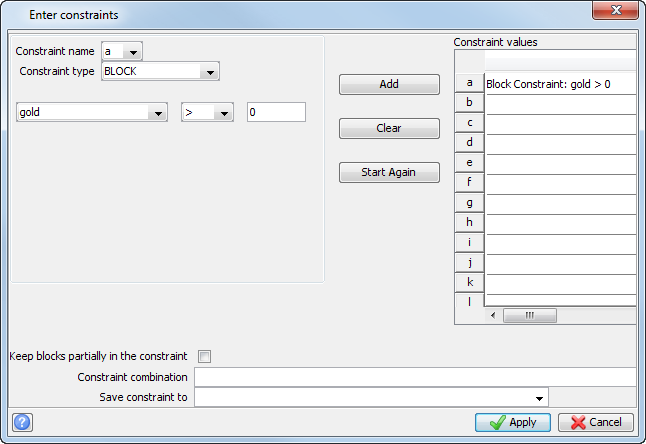
- In Constraint type, select BLOCK and fill in the three input boxes below so that the constraint is “gold > 0”.
- Click Add to add the constraint, and then click Apply.
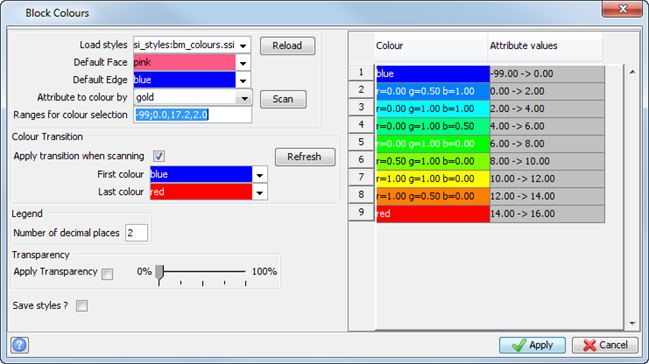
- Click the block_model icon, and select Colour by attribute.
- Select gold for the Attribute to colour by.
- Select the Apply transition when scanning check box.
- Click Scan.
- Click Apply.
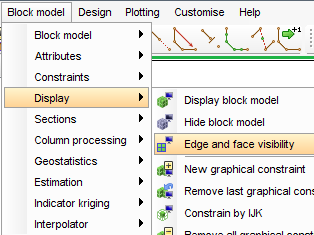
- Choose Block Model > Display > Edge and face visibility.
- Clear the Display block edges check box, and click Apply.
- Choose Block Model > Attributes > View attributes for one block.
- Click any block.
- Click Cancel.
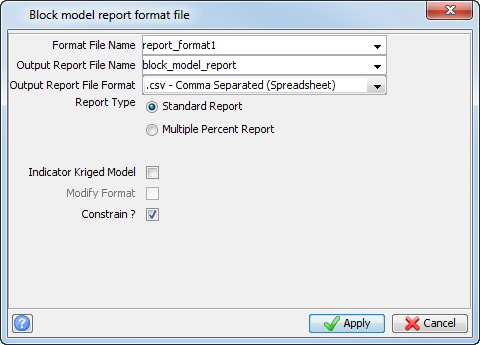
- Choose Block model > Block model > Report.
- Enter the information as shown, and click Apply.
- Enter the information as shown, and click Apply.
- Enter the information as shown, and click Apply.
When a block model is open, the name of the block model is displayed on the Status bar at the bottom of the Surpac window.
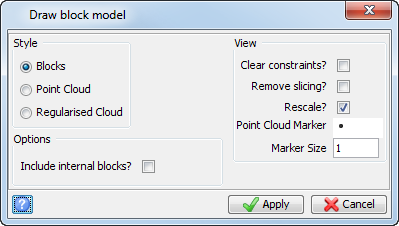
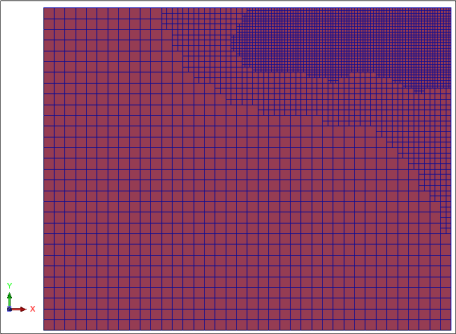
The block model is displayed in Graphics.
Next, you will display only those blocks which have a gold value greater than zero, using a "constraint". A constraint can be thought of as a filter which selects blocks that meet a set of conditions.
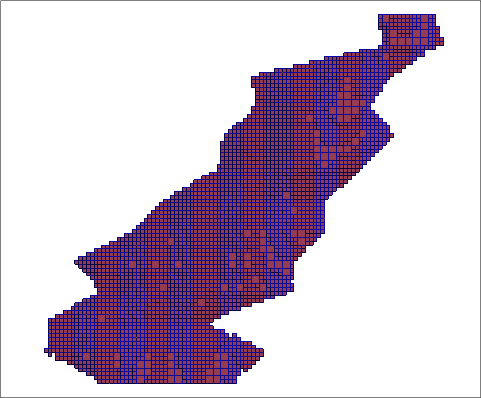
The blocks that have a gold value greater than zero are displayed.
Next, you will colour the blocks by gold values.
A default set of colours are displayed.
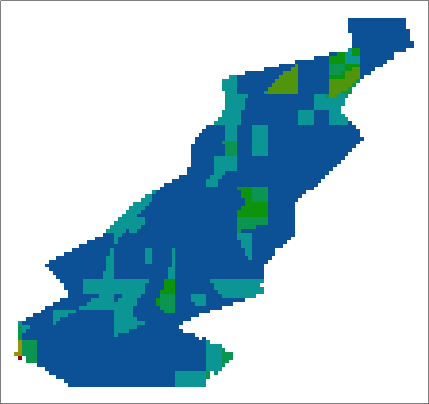
The blocks are coloured by gold values.
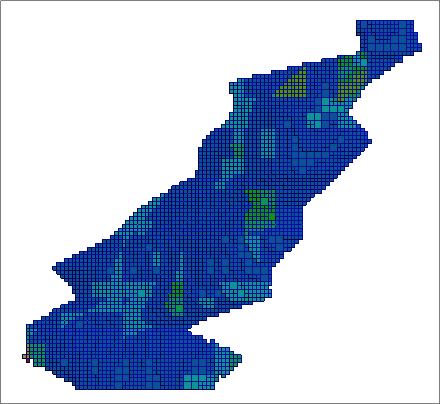
Note: You might need to click and drag the model to see the colours.
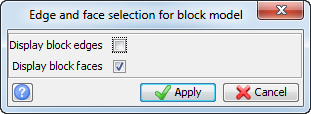
Only the block faces are displayed.
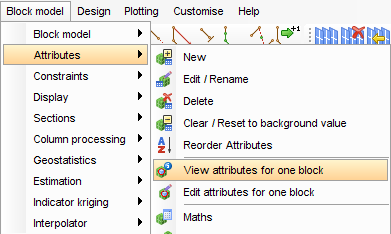
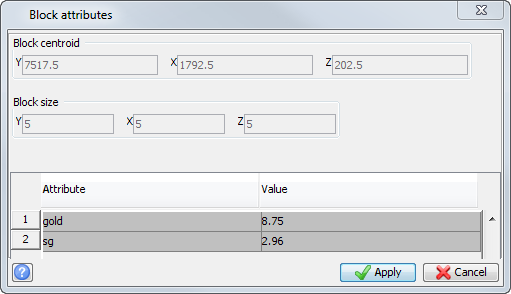
The selected block is highlighted, and the attribute values for the block are displayed.
Next, you create a report of the volume, tonnes, and average gold grade.
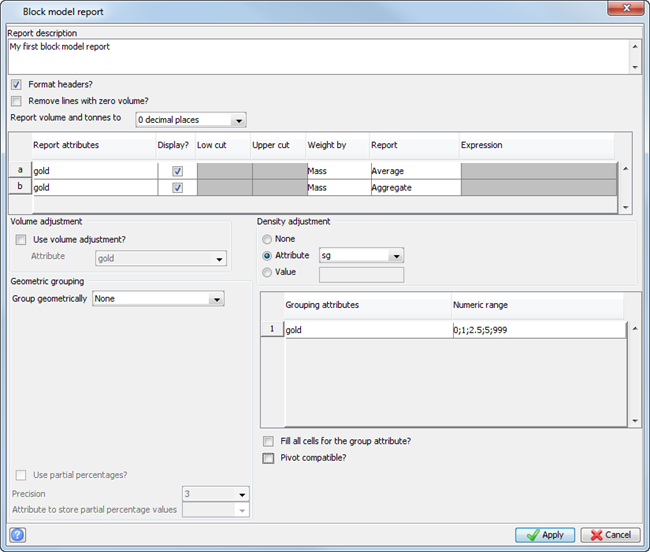
Note: To add a new report attribute row, right-click below the row and select Add.

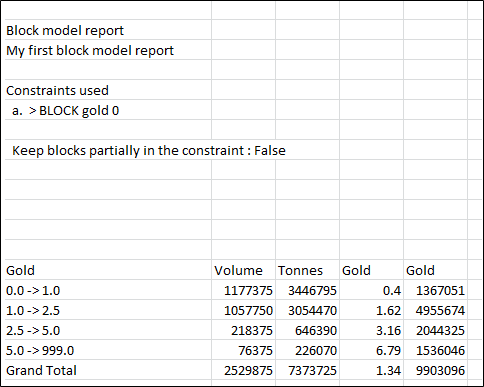
The report contains volume, tonnes, average gold (grams per tonne) and aggregate gold (total grams of contained metal) for each grade range.
Note: To see all of the steps performed in this task, run 06b_block_model.tcl.
You need to click Apply on any forms presented.
Plotting with autoplot
There are two ways to create plots in Surpac:
- to create simple plots from data displayed in graphics, use Autoplot
- to create complex plots from files on disk:
- use the Plotting > Entity submenu to create or modify entity definitions
- use the Plotting > Map submenu to create or modify map definitions
- use the Plotting > Process submenu to create the final plot
This section describes Autoplot only. The Plotting Tutorial describes how to create complex plots.
Task: Produce a plot of a pit using autoplot
- Click Reset graphics .
- Open pit_design1.str in Graphics.
- Choose Plotting > Autoplot.
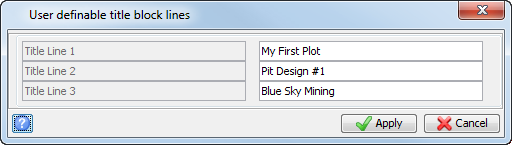
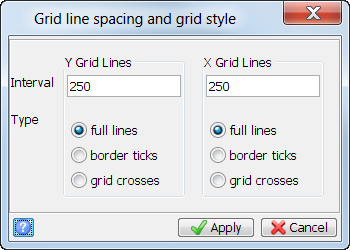
- Enter the information as shown, and click Apply.
- Enter the information as shown, and click Apply.
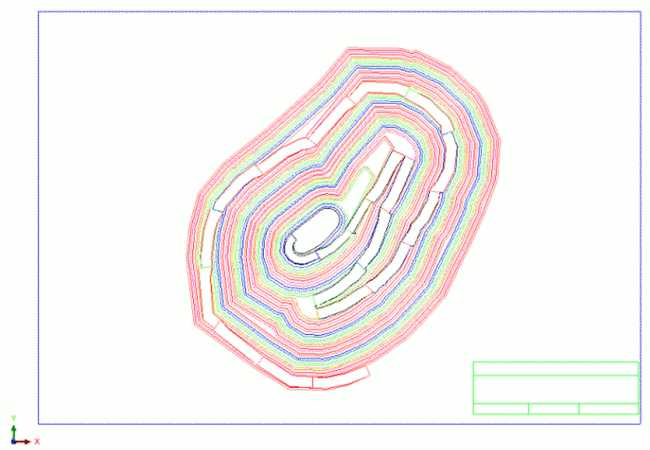
- Use the scroll wheel to zoom out, then click and drag with the left mouse button in Graphics to move the plot outline.
- When the plot border is positioned where you want it, Press F2.
- Enter the information as shown, and click Apply.
Note: Make sure you select the Lock X/Y scale check box.
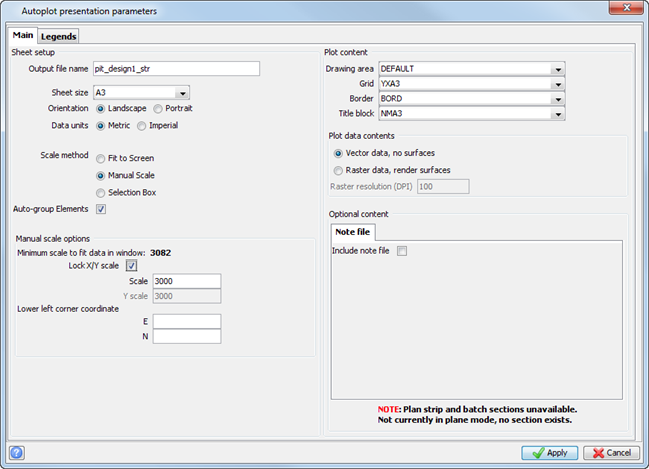
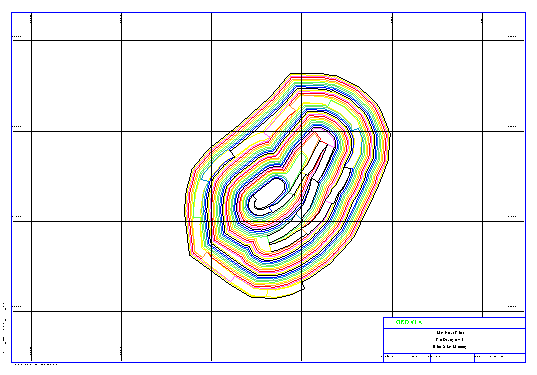
The plot is displayed in the plot preview window.
Note: To see all of the steps performed in this task, run 06c_plotting_with_autoplot.tcl.
You need to click Apply on any forms presented.