


File tools
The File tools menu contains several different functions that you can use to filter, classify, transform, split, combine, intersect, and perform mathematical operations on string files.
For the tasks within this section, the data is displayed in Graphics to help you understand how the functions work. However, you do not have to view the data to run any of the File tools functions.
String maths
You can use String Maths to perform mathematical operations on string files, such as:
- convert section coordinates to real-world coordinates.
- add a constant value to a coordinate (such as the northing) of all strings.
- apply a topcut to sample values.
Task: Convert section coordinates to real-world coordinates
You will use String Maths to convert a string file in which the Y field represents the real-world Z value, and the Z field represents the real-world Y value. This is a common approach used when data on a cross section has been digitised from a tablet.
- Click Reset graphics
 .
. - Open ore_section1.str in Graphics.
- Choose Display > Dynamic 2D grid.
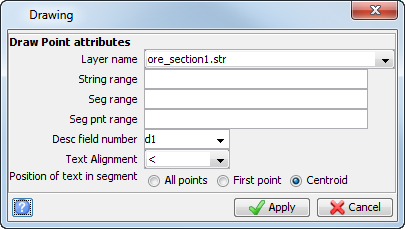
- Choose Display > Point > Attributes.
- Enter the information as shown, and click Apply.
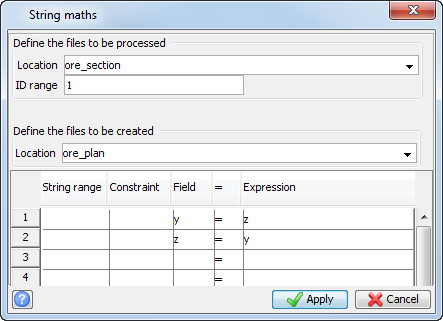
- Choose File tools > String maths.
- Enter the information as shown, and click Apply.
- Click Reset graphics .
- Open ore_plan1.str in Graphics.
- Choose Display > Dynamic 2D grid.
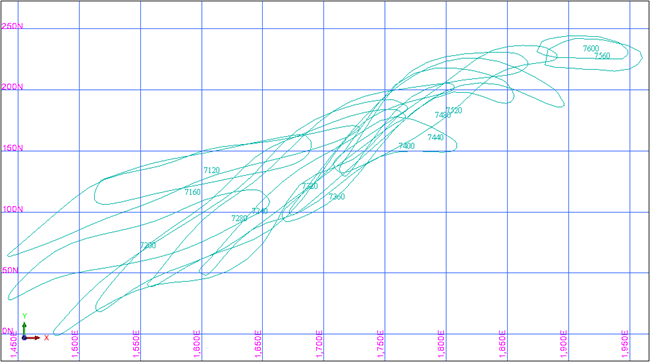
The strings in ore_sections1.str are sectional interpretations of ore zones that have been digitised from a digitising tablet. The Y field of ore_sections1.str represents the real-world elevation, or Z value. The Z field of all points on each segment of ore_sections1.str represents the real-world northing, or Y value. The X field is the real-world easting.
Next, use String maths to convert this data to real-world coordinates by swapping the Y and Z values.
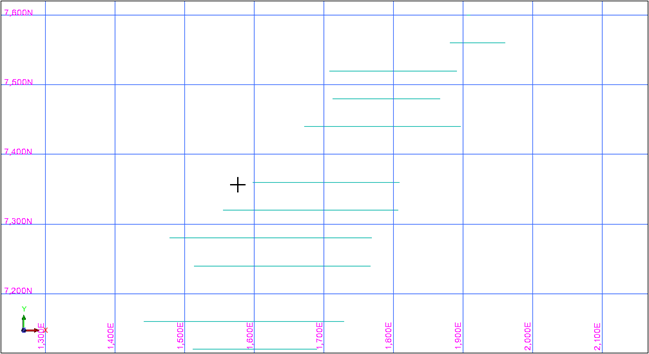
The strings in ore_plan1.str represent the real-world coordinates.
 Note: To see all of the steps performed in this task, run
05a_string_maths1.tcl. You need to click
Apply on
any forms presented.
Note: To see all of the steps performed in this task, run
05a_string_maths1.tcl. You need to click
Apply on
any forms presented.
Task: Adjust coordinates
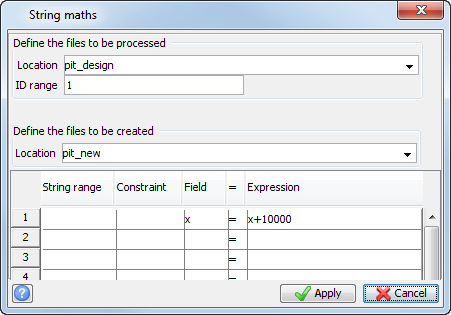
You will use String Maths to adjust the easting, or X value of all data in a string file. You would adjust the coordinates when there are two coordinate systems that are used for a string file or when you need to correct an error made in the coordinate values when the data was created.
- Click Reset graphics .
- Open pit_design1.str in Graphics.
- Choose File tools > String maths.
- Enter the information as shown, and click Apply.
- Open pit_new1.str in Graphics.
- Choose View > Zoom > All.
- Choose Display > Dynamic 2D grid.
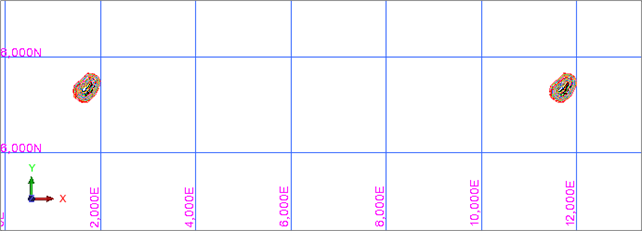
The easting of pit_new1.str is 10,000 meters greater than pit_design1.str.
Note: To see all of the steps performed in this task, run 05b_string_maths2.tcl. You need to click Apply on any forms presented.
Task: Topcut high grade samples
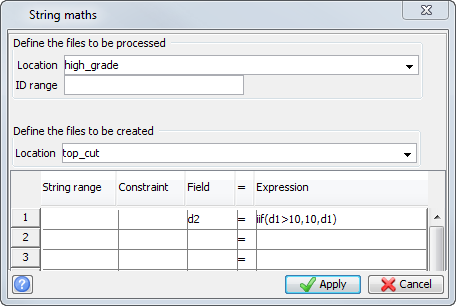
You will use String Maths to set values in a string file that are above a maximum value equal to a given value. You would want to do this if you have sample data that you want to use for a resource estimation in which you do not want to allow extreme data values to have too much influence on the estimation.
- Click Reset graphics.
- Open high_grade.str in Graphics.
- From the Navigator, right click high_grade.str, and select Edit.
- Choose File tools > String maths.
- Enter the information as shown, and click Apply.
- Click Reset graphics.
- Open top_cut.str in Graphics.
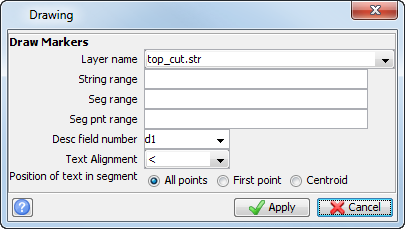
- Choose Display > Point > Markers.
- Enter the information as shown, and click Apply.
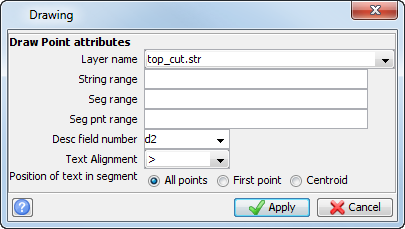
- Choose Display > Point > Attributes.
- Enter the information as shown, and click Apply.
- In the Navigator, right click top_cut.str, and select
Edit.
The file opens in a text editor. The values in the D2 field represent the "topcut" values, and are displayed to the left of the point in Graphics.
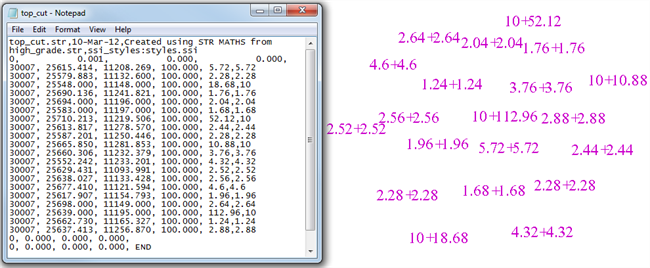
Notice that where the D1 value is less than 10, the D2 value is equal to the D1 value. Where the D1 value is greater than 10, the D2 value has been topcut to 10.
The file opens in a text editor. The sample values in the D1 field are displayed in Graphics.
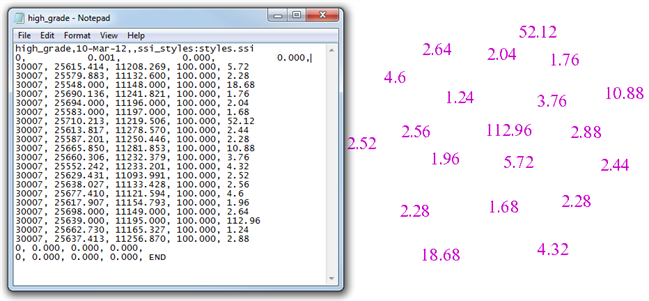
Most of the data values are between 1 and 10, but there are a few values above 10. You will now use String Maths to "topcut", or convert values that are above 10 to the value of 10.
Note: To see all of the steps performed in this task, run 05c_string_maths3.tcl. You need to click Apply on any forms presented.
Clip data by a boundary
You can use Apply boundary string to remove data inside or outside a closed, clockwise boundary string.
Task: Apply a boundary string to a soil sampling file
You will use Apply boundary string to remove data outside a boundary string.
- Click Reset graphics .
- Open soil1.str in Graphics.
- Open bdy100.str in Graphics.
- Choose Display > Strings > With string numbers.
- Enter the information as shown, and click Apply.
- Choose Inquire > Point Properties.
- Select one of the markers (a spot height string).
- Choose File tools > Apply boundary string.
- Enter the information as shown, and click Apply.
- Click Reset graphics .
- Open soil2.str in Graphics.
- Open bdy100.str in Graphics.
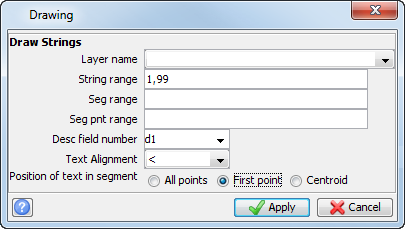
Strings 1 to 99 are labelled and displayed in Graphics. The spot height string number 30003 is displayed in the message window.
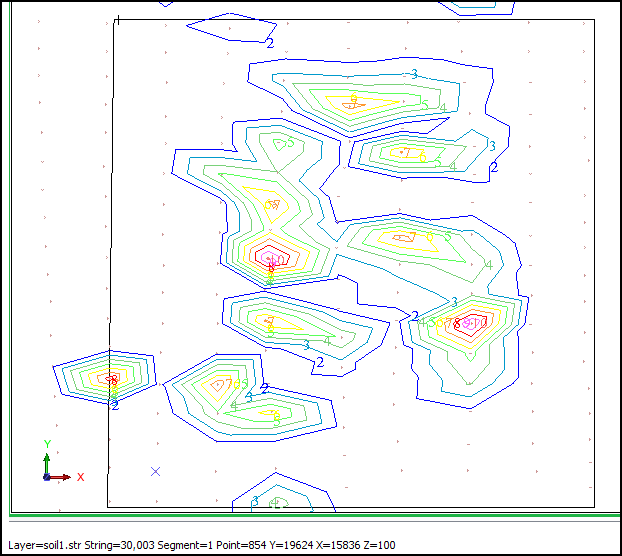
You will clip the data in soil1.str by string 1 in bdy100.str. String 30003 in soil1.str is the only spot height string.
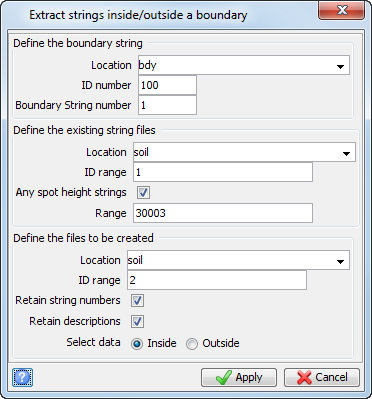
Note: When you apply a boundary string to spot heights, only those points that lie inside or on the boundary are saved. For strings that are not defined as spot height strings, new points are created where the boundary string intersects the line.
Data in soil2.str is contained within the boundary.
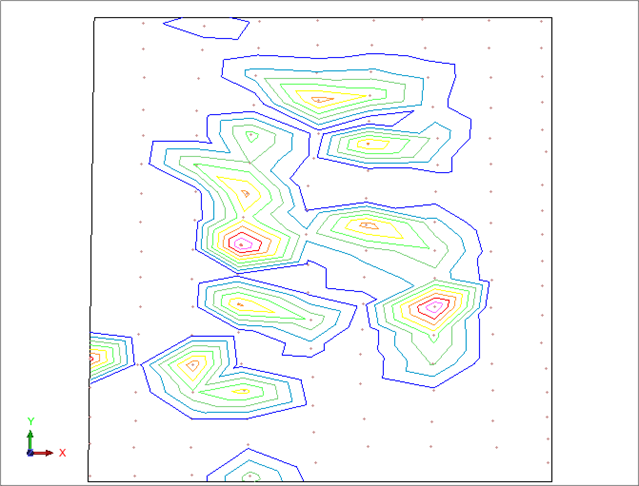
Note: To see all of the steps performed in this task, run 05d_apply_boundary.tcl. You need to click Apply on
any forms presented.
Classify strings
You can use Classify strings to assign a string number based on the value of the Y, X, Z, or description field. You can also display the data with different colours or line thicknesses.
Task: Colour points by sample values
You will use Classify strings by numbers to display sample values of points in different colours.
- Open samp1.str in Graphics.
- Choose Display > Point > Attributes.
- Enter the information as shown, and click Apply.
- Choose File tools > Classify strings by numbers.
- Enter the information as shown, and click Apply.
- Click Reset graphics .
- Open samp_classified1.str in Graphics.
- Choose Display > Hide everything.
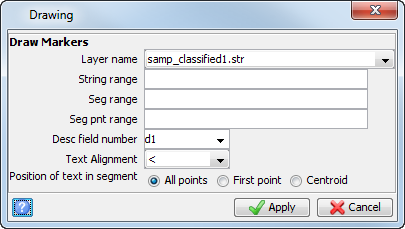
- Choose Display > Point > Markers.
- Enter the information as shown, and click Apply.
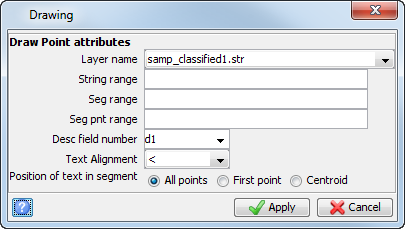
- Choose Display > Point > Attributes.
- Enter the information as shown, and click Apply.
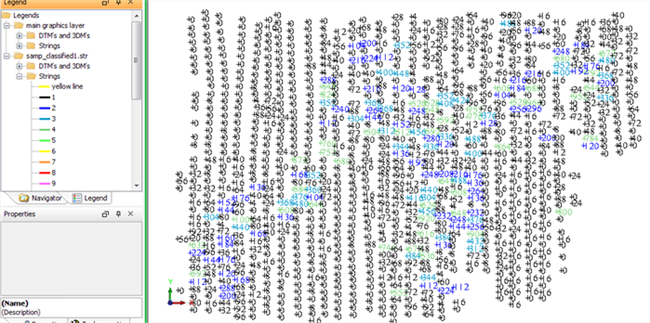
- Select the Legend tab, and expand the Strings legend for samp_classified1.str as shown below.
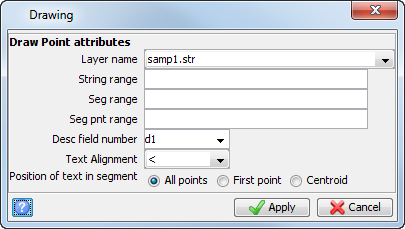
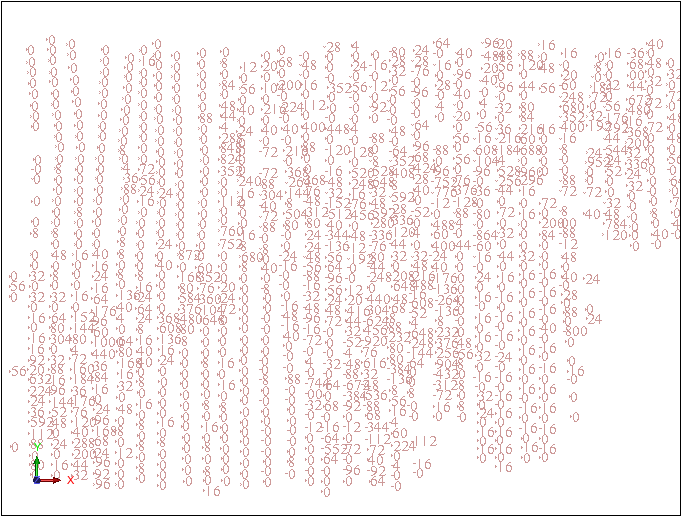
The D1 value for each point is displayed.
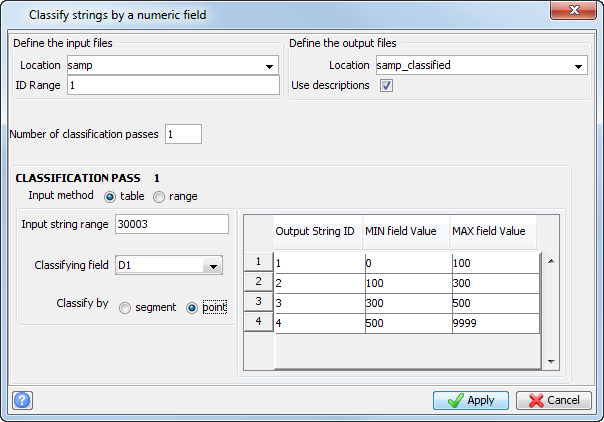
Note: Press TAB to create a new row in the classification table.
The points have been classified and are displayed according to the colour of each string.
Note: To see all of the steps performed in this task, run 05e_classify_strings.tcl.
You need to click Apply on any forms presented.
2D transformations
You can use 2D transformations to transform data from one coordinate system to another. Before you run this function, you must know what the coordinates of two points are in each of the two systems. You can also add or subtract a constant value to the Z coordinates between the two systems.
Task: Transform data to a different coordinate system
You will transform pit1.str into the same coordinate system as pit2.str using 2D transformation. You will be provided with the coordinate values of the two points in each of the two systems, as well as a Z correction.
- Click Reset graphics .
- Open pit1.str in Graphics.
- Choose Inquire > Report layer extents to show the coordinate extents in the message window.
- Open pit2.str in Graphics.
- Choose Inquire > Report layer extents to show the coordinate extents in the message window.
- Click Zoom to data extents
 .
. - Choose File tools > Transformations > 2D transformation of string file.
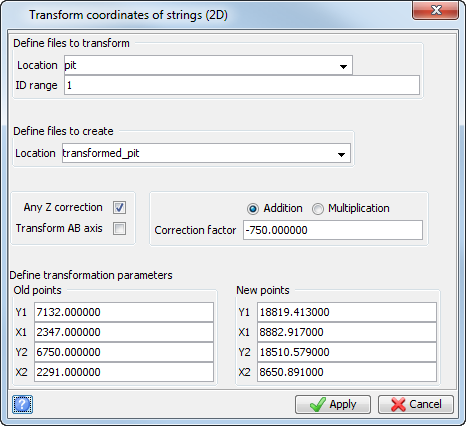
- Enter the information as shown, and click Apply.
- Old points are the coordinates of the two points in the existing coordinate system. New points are the coordinates of the same two points in the coordinates system to which you are transforming the data.
- The Z coordinates of the new system are 750 meters below the Z value of the existing system.
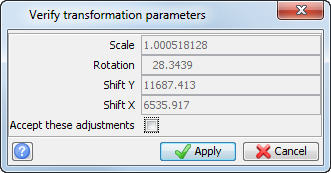
- If the grids are plane metric grids, the scale should be very close to 1.0. In this example, there is an error of 0.5 mm in per meter.
- The rotation is displayed in DDD.MMSS format.
- Shift Y is the difference between Y1 (old) and Y1 (new) as entered on the first form.
- Shift X is the difference in easting between X1 (old) and X1 (new).
- Select the Accept these adjustmentscheck box, and click Apply.
- Open transformed_pit1.str in Graphics.
- Click Zoom to data extents .


Note:
The transformation parameters are displayed.
Note:

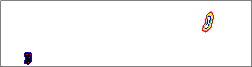
At the top of the screen you can see both pits in the same coordinate system. Notice transformed_pit1.str has been shifted north and east, and it has also been rotated.
Note: To see all of the steps performed in this task, run 05f_2d_transform.tcl. You need to click Apply on any forms presented.
Polygon intersection
You can use Intersect polygons to perform an intersection, outersection, or union of two or more closed segments.
| Operation | Example of Usage |
|---|---|
|
Intersection |
Determining the area which is common to two closed strings. By intersecting two closed strings you produce a string which has one or more segments which represent the area common to the two strings. |
|
Outersection |
Determining the material which might remain after an excavation is completed, for example the excavation of an open pit. |
|
Union |
Joining two strings together to represent the total area of both strings, for example to represent the shape which will remain after two intersecting pits are excavated. |
Task: Calculate the area of an ore zone within a pit
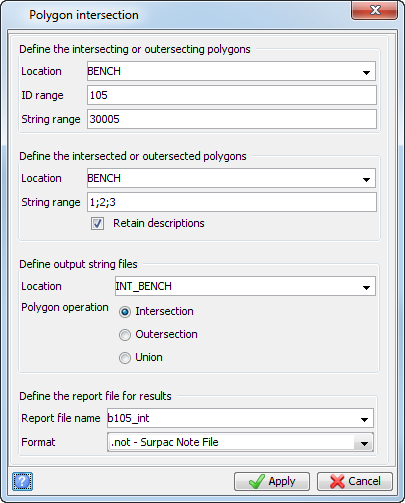
You will intersect closed, clockwise ore zone strings at a midbench elevation (105) with a closed, clockwise midbench contour of a pit design at the same elevation. Afterward, you will display the clipped strings and the area of each segment.
- Click Reset graphics
- Open bench105.str in Graphics.
- Choose Display > Hide everything.
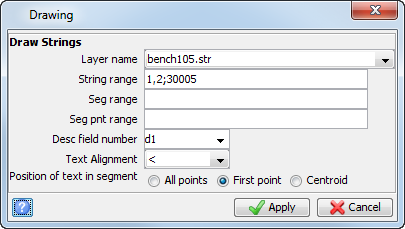
- Choose Display > Strings > With string numbers.
- Enter the information as shown, and click Apply.
- Choose File Tools > Intersect polygons.
- Enter the information as shown, and click Apply.
- Click Reset graphics .
- Open int_bench105.str in Graphics.
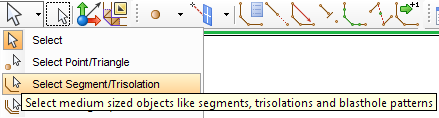
- From the Selection menu on the Tools toolbar, click Select Segment/Trisolation.
- Select each segment.
Strings 1, 2, 3, and 30005 are displayed.
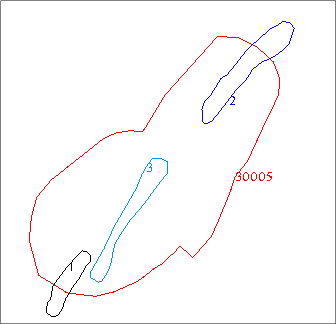
Note: Strings 1,2, and 3 will be intersected by string 30005.
The clipped strings are displayed.
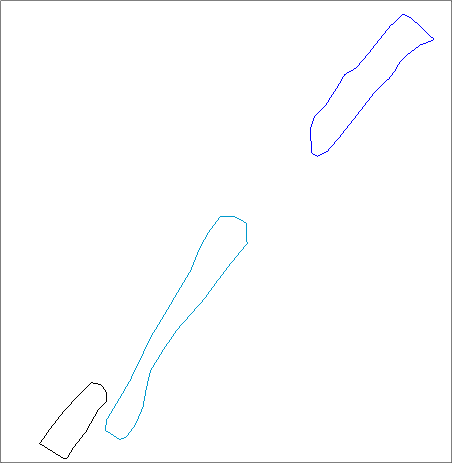
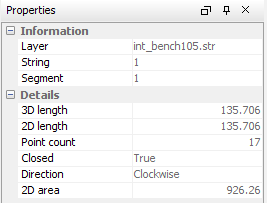
The area of the segment is shown in the bottom row of the Properties pane.
Note: To see all of the steps performed in this task, run 05g_intersect_polygons.tcl. You need to click Apply on any forms presented.
Task: Clip ore blocks inside a pit
You will intersect closed, clockwise block model strings at a midbench elevation (135) with a closed, clockwise midbench contour of a pit design at the same elevation. Afterward, you will display the clipped strings.
- Clear Reset graphics .
- Open kbb135.str in Graphics.
- Open con135.strin Graphics.
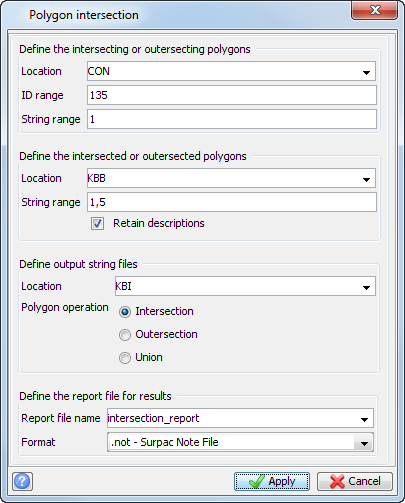
- Choose File tools > Intersect polygons.
- Enter the information as shown, and click Apply.
- Click Reset graphics .
- Open kbi135.strin Graphics.
- Open con135.str in Graphics.
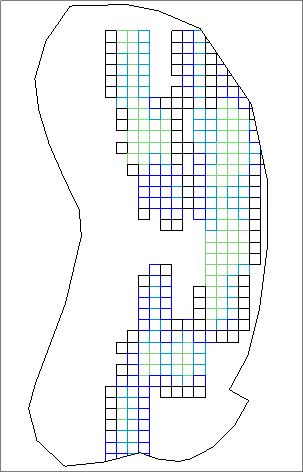
The two files are displayed in Graphics. Some of the ore blocks are outside the pit boundary.
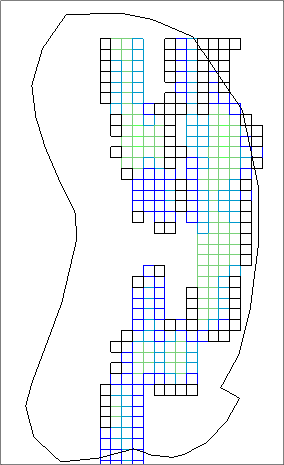
Note: The file kbb135.str contains strings 1,2,3,4, and 5. The file con135.str contains strings 1. All strings are at the same elevation.
The blocks inside the boundary are displayed.
Note: To see all of the steps performed in this task, run 05h_clip_ore_blocks.tcl. You
need to click Apply on any forms presented.