


Outliers
Overview
Outliers are data values outside the range of most of the data within one domain. If left in the data set, outliers can cause problems with variograms, and can reduce the quality of estimations.
You will learn about:
- outliers
- how to remove outliers
- Selection of a cutoff value
Requirements
In order to understand this information, you should:
- be familiar with Surpac string files
- know how to run a Surpac macro
Outliers
An “outlier” is a statistical term for a data value which is relatively distant from the majority of all other values in the data set. For example, in the following data set, the number 236 would be considered to be an outlier:
1 3 5 5 8 8 8 236
Outliers can cause problems with the calculation of variograms. Additionally, if used in an estimation, outliers can cause an unrealistic results. One technique used to reduce the impact of outliers is to apply a “cutoff” to them. In the example above, the value of 236 could be “cut”, or changed to a value of 9.
1 3 5 5 8 8 8 9
Another alternative is to remove the outlier value(s).
Removing outliers
Looking back to the histogram of gold_comp2.str, as well as the output report, you can see that the majority of the data is grouped between values of 0 and 10 grams per tonne. You can also see that there are several outlier values above 10 grams per tonne.
Task: Removing outliers
- Run 03_cut_outliers.tcl.
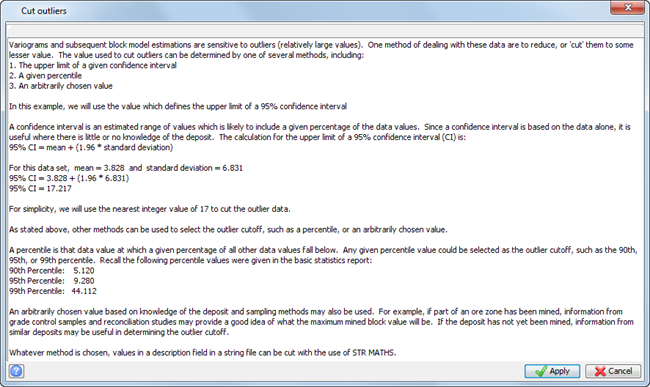
- After reading text on the first form, click Apply.
- After viewing the form, click Apply.
- After viewing the form, click Apply.
- After viewing the form, click Apply.
- After reading the following form, click Apply.
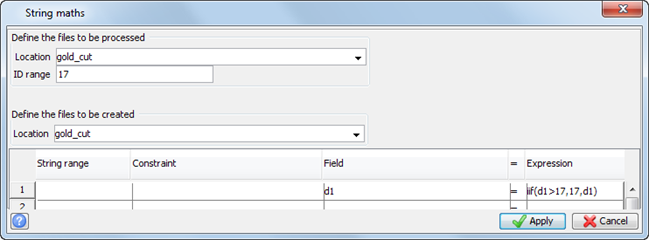
STR MATHS is invoked by selecting File tools > String maths.
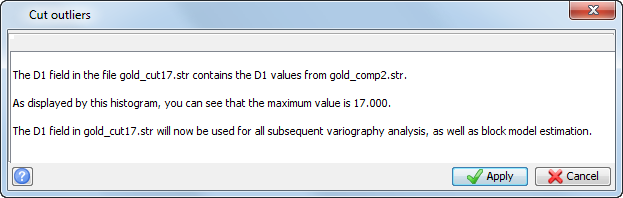
This form prompts you to enter the name of the input and output files, as well as an expression. Prior to viewing this form, the macro has opened gold_comp2.str and saved it as gold_cut17.str.
The D1 field will receive the result of the expression:
iif(d1>17,17,d1)
This expression can be reworded as:
If the initial value of d1 is greater than 17,
then set the value of d1 equal to 17,
else leave the value of d1 as it was initially.
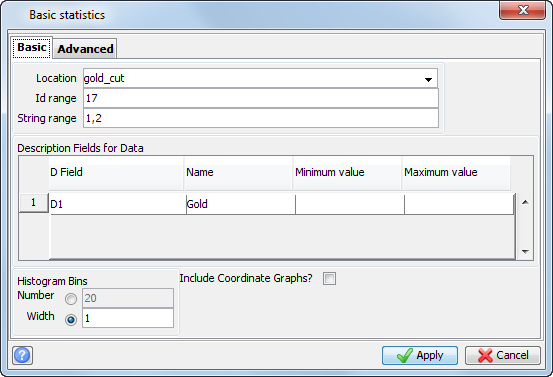
In order to validate the output from STR MATHS, you will analyse the data in the Basic Statistics window. Again, you run this function by selecting Geostatistics > Basic statistics.
Next, the macro will choose File> Load data from string files, and the form below is displayed. Notice that gold_cut17.str is the file being analysed.
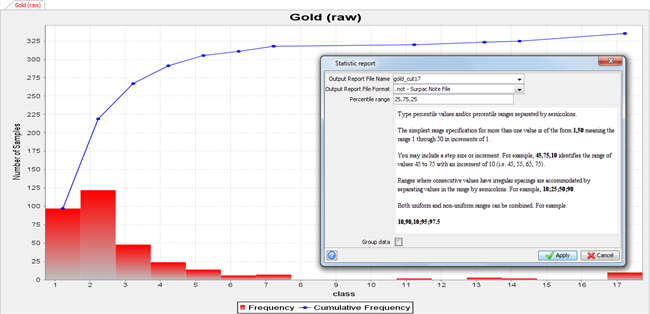
Next, a histogram and a line representing the cumulative frequency is displayed. Notice that the maximum data value is now 17.
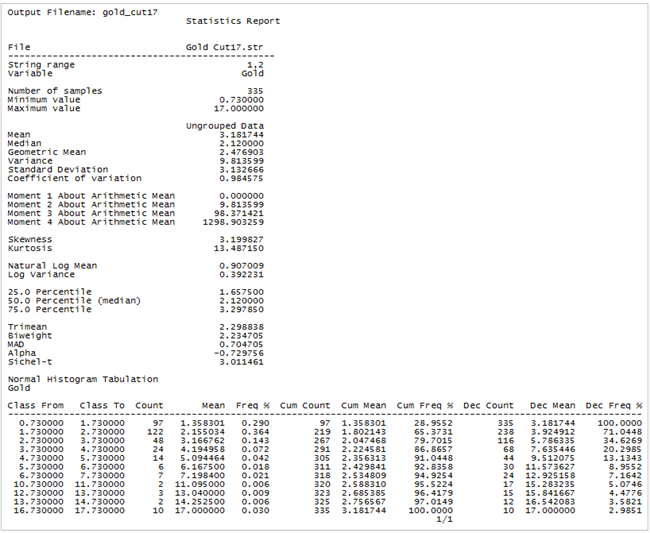
Then, the macro selects Statistics > Report. The Statistics report form prompts you to enter the name of an output report, the report format, and a range of percentiles which will be written to the report.
The output report gold_cut17.not contains several output statistics, including the specified percentiles. This file is created in the directory, but not displayed by the macro. You can open it if you want to verify that the maximum value is 17.
Menu commands:
| Select... | to... |
|---|---|
| Geostatistics > Basic statistics | open the Statistics window. |
| From the Statistics Window: | |
| File > Load data from string files | create a histogram. |
| Statistics > Report | create a report. |
| File tools > String maths | invoke STR MATHS. |