


Model Validation
Overview
An important step in a geostatistical evaluation is to validate the model after it has been created. There are several means of validation:
- comparing cross-sectional data with model values
- grade-tonnage curves from block model reports
- basic statistics of model values
- trend analysis
Requirements
In order to understand this information, you should understand the following concepts:
- Surpac menu bars
- Surpac string files
- Surpac block models
- isotropy and anisotropy
- anisotropy ellipsoid
- ordinary kriging
Comparing cross-sectional data with a model
One method of validating a model is to view cross-sections of it compared to other data.
Task: Comparing cross-sectional data with a model
- Run _15a_display_partial_percent.tcl.
- Run _15b_display_blocks&composites.tcl.
This macro will display a cross-section of a 3D solid, and the calculated partial percentage of blocks inside the solid.
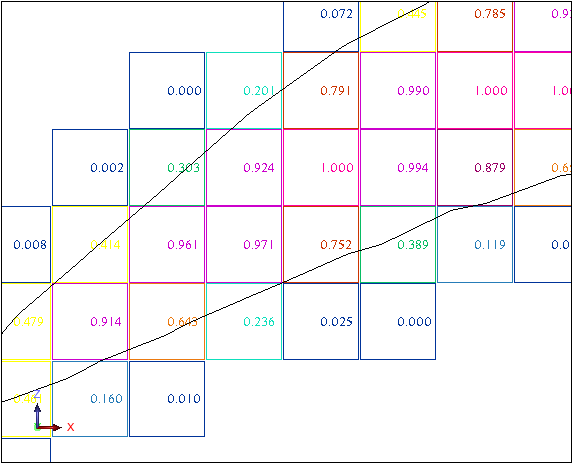
You want to ensure that the values in the model appear to be correct. In the example, this does appear to be correct. Blocks entirely within the model have a partial percent value of 1.00 and blocks partially within the model have a partial percentage value between 0 and 1.00.
This macro will display a cross-section of a 3D solid, raw and composited drillhole data, as well as kriged values of blocks inside the solid.
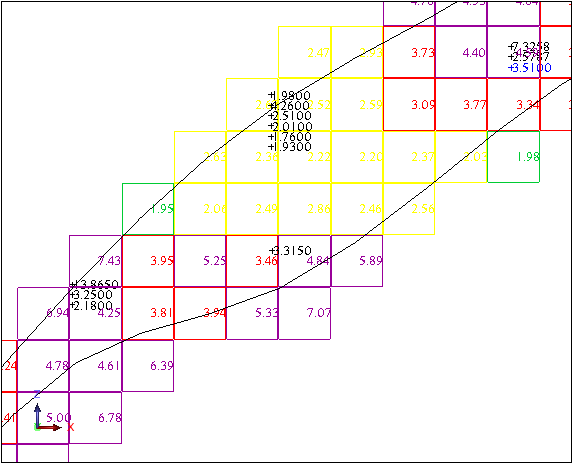
Again, you want to check that block values and model values appear to be correct.
Grade-tonnage curves
Another means of validating a model is to report tonnes and grade and construct a grade-tonnage curve.
Task: Create grade-tonnage curves
- Run _16a_bm_report.tcl.
- View, and then click Apply on each of the three following forms.
- Open grade_tonnage.xls.
This macro will perform block model reporting to create a *.csv file containing grade and tonnes. A pre-defined *.xls file is displayed at the end with a graph of the grade-tonnage curve.
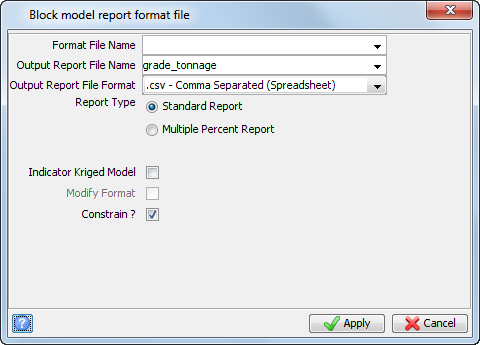
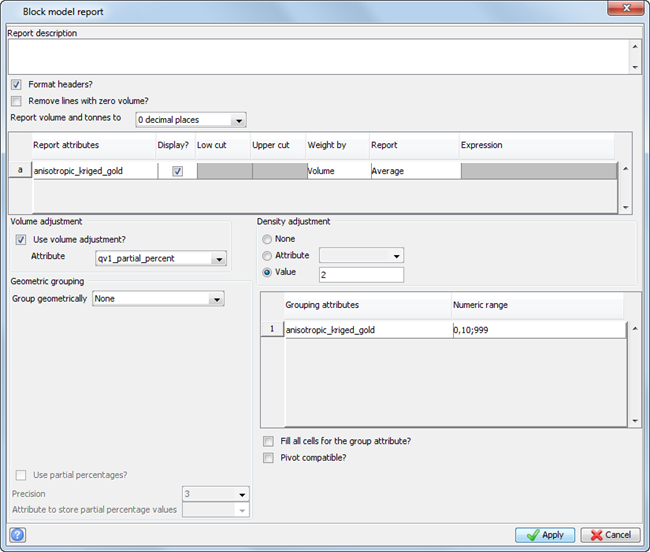
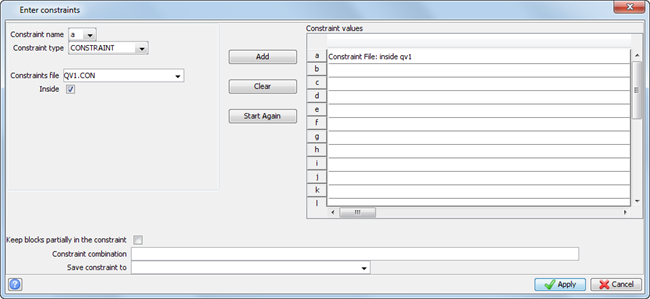
The file grade_tonnage.xls has been prepared with a graph of the output data.

Basic statistics of model values
Basic statistics of the block model values is another way to validate the output from the model.
Task: Display basic statistics of model values
- Run _12_bm_basic_stats.tcl.
- Select the check boxes on the Basic statistics form as shown, and click Apply.
- Choose File > Close.
This macro will display basic statistics on three block model parameters.

You will see a histogram of the data displayed.

Trend analysis
You can also analyse the trends in the data to validate the output from the model.
Task: Display trend analysis
- Run _16b_export_centroids.tcl.
- View, and then click Apply on both of the following forms.
- Run the macro _16c_bm_vs_composites.tcl.
- Click the Co-ordinate Constraints tab to view the range of coordinate values.
- View the form, and then click Apply.

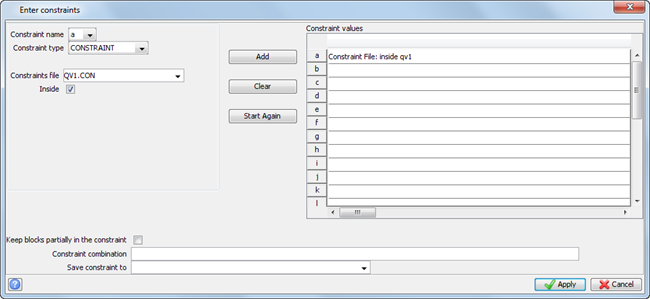
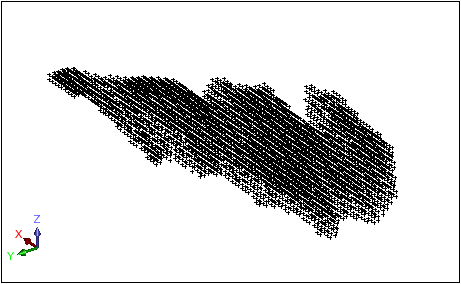
When the data has been exported, you will see the data in Graphics.
This macro performs the function Geostatistics > Trend analysis. There are two tabs on the Trend analysis form.
The main tab contains the names of the file(s) to be analysed.
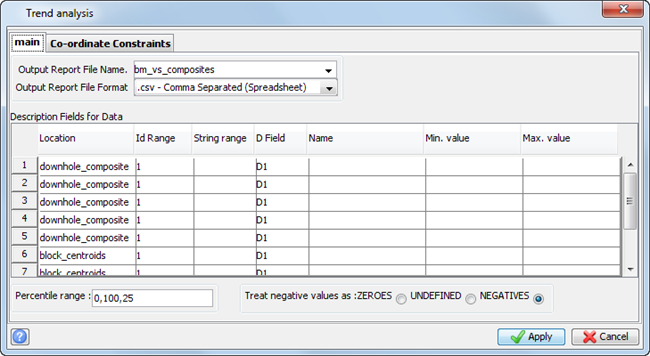
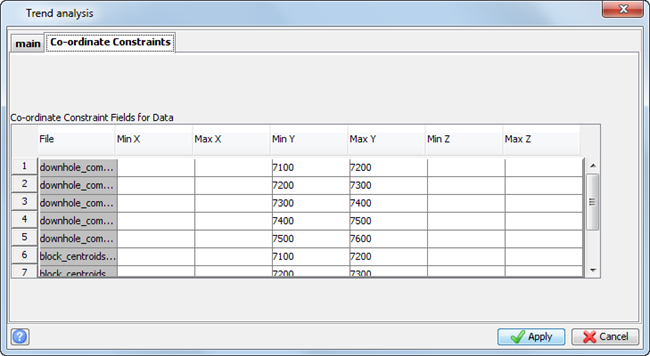
 Note: In this case, you want to compare the downhole composite values against the block centroids for a range of northings.
The previously prepared file bm_vs_composites.xls contains the data and a graph.
Open bm_vs_composites.xls.
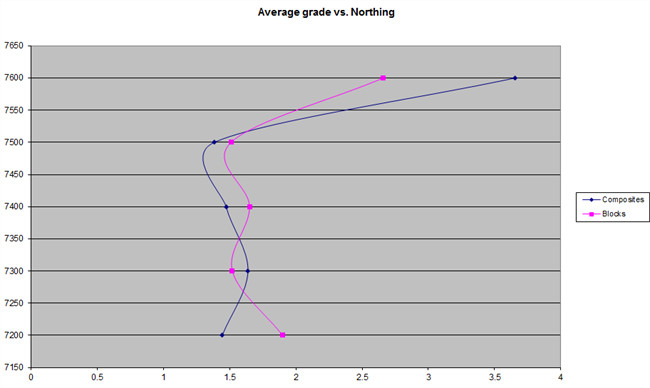
Trend analysis can be used to identify regions where block model estimations might be different to the composited data.