


Basic Statistics
Overview
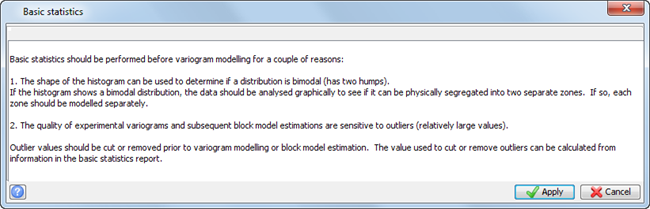
One of the important preliminary steps in performing a geostatistical evaluation is to understand the statistical properties of the data. Two characteristics which can potentially reduce the quality of your estimations are bimodalism and outliers. A histogram can be used to identify whether either of these conditions are present in your data.
You will learn about:
- histograms
- bimodal distributions
- creating a histogram
Requirements
In order to understand this information, you should:
- be familiar with Surpac string files
- know how to run a Surpac macro
Task: Displaying histograms
- Run the macro 02_basic_statistics.tcl.
- Read the text on the first form, and click Apply.
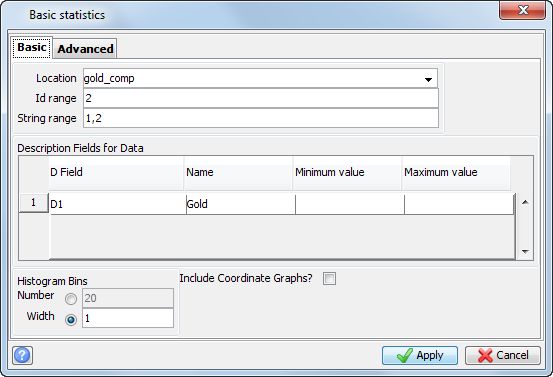
- Review the settings on the Basic statistics form, and click Apply .
- Review the settings on the Statistic report form, and click Apply.
- Read the text below on the following form, and click Apply.
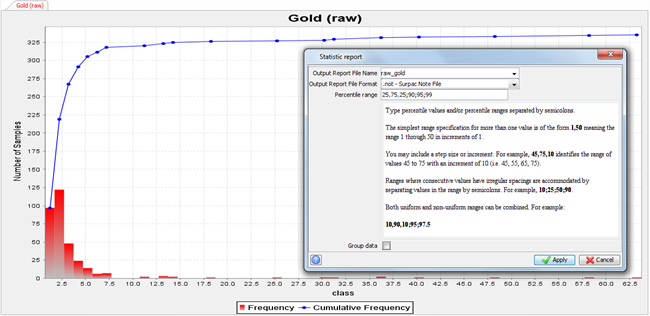
A histogram and a line representing the cumulative frequency is displayed. The cumulative frequency is an accumulation of the values of all previous histogram bins.
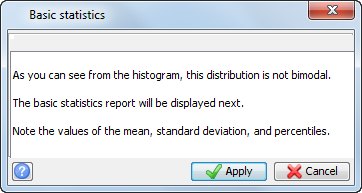
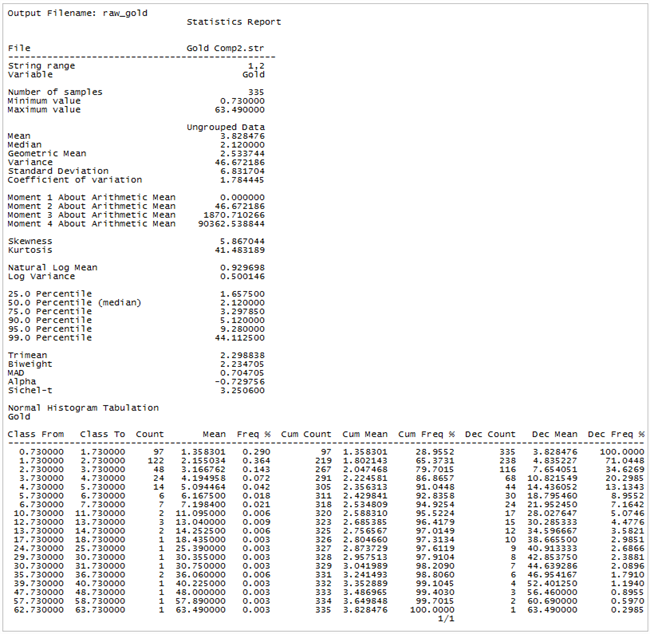
The output report raw_gold.not is displayed in your default text editor. This report contains several output statistics, including the specified percentiles. You will refer to this report in the next section of this tutorial.
Menu commands:
| Select... | to... |
|---|---|
| Geostatistics > Basic statistics | open the Statistics Window. |
| From the Statistics Window: | |
| File > Load data from string files | create a histogram. |
| Statistics > Report | create a report. |