


Modelling a variogram
Overview
There are a number of tools to help you model a variogram in Surpac.
You will learn about:
- creating a best-fit variogram model
- saving variogram data
- modifying the lag
- types of experimental variograms
- types of variogram models
- multiple structures
- variogram modelling tips
Requirements
In order to understand this information, you should:
- be familiar with Surpac string files
- know how to run a Surpac macro
- understand basic variogram concepts, such as nugget, sill, lag, and multiple structures
Task: Open an experimental variogram and model
- Open omni.evg.
- Practice using the lag slider.
- Choose Variogram > Model.
- Click and drag either of the "variogram structures" (light blue dots) to change the shape of the model.
- Choose Display > Display / Hide number of pairs.
- Choose Variogram > Add structure.
- Click and drag the "variogram structures" to fit the data as shown.
- Choose Variogram > Report.
- Enter the information as shown, and click Apply.
- Choose File > Save > Variogram model.
- Enter the information as shown, and click Apply:
- Choose File > Close to close the Variogram Modelling window.
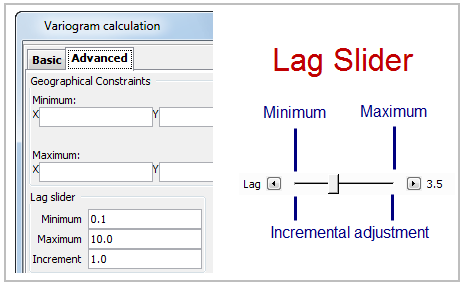
Remember that the maximum, minimum, and incremental values are set on the Advanced tab, and that the right and left arrow keys on your keyboard will increase and decrease the lag by 0.1.
The model is displayed.
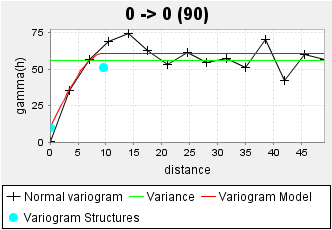
The model displayed is a best-fit model to the experimental variogram data.
 Note: You can ignore experimental data points with relatively low number of pairs.
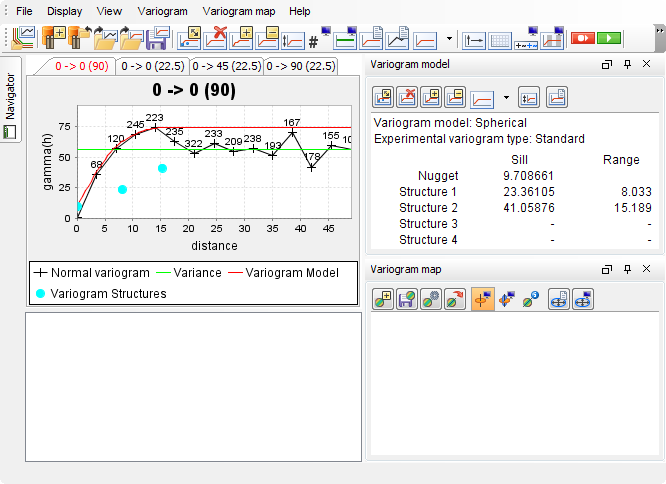
Note: The variogram parameters are updated as you move the structures.

Note: The sum of the nugget and all sill values equals the “total sill”.
The file omni.not is created in the current working directory.

To see all of the step performed in this task run 2d_06a_variogram_modelling.tcl.
Types of variogram models
- Open omni.evg.
- Open omni.vgm.
- Choose Display > Set axis limits.
- Enter the information as shown, and click Apply.
- Choose Variogram > Variogram model type > Exponential.
- Choose Variogram > Variogram model type > Gaussian.
- Choose Variogram > Delete structure.
- Choose Variogram > Variogram model type > Hole Effect.
- Click and drag the structures as shown.
- Choose File > Close.

|
Spherical Model |
Exponential Model |
|
Gaussian Model |
Hole Effect Model |
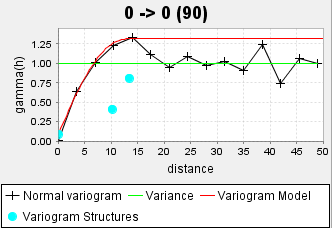
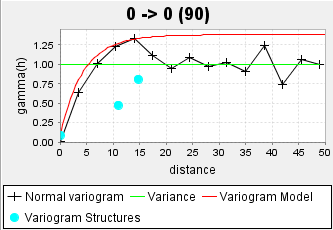
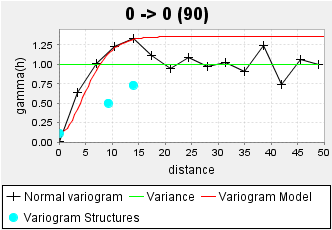
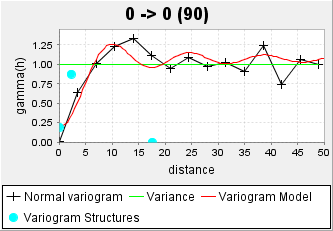
To see all of the steps in this task run 2d_06b_variogram_model_types.tcl.
Variogram modelling tips
Modelling a variogram is not an exact science. However, the following are some tips that might help you:
- Try to find the variogram that has the longest range and the lowest variability.
- Try to model the “trend”. One way to see the “trend” of the data is to create a variogram model, then drag the lag slider back and forth. The model should fit the data reasonably well for a few different lags.
- Consider the geology of the domain. Does the model you come up with look reasonable for your data? Is the nugget effect high or low? Is the range approximately what you expected? If not, perhaps you should reconsider the data domains.
- Search the Internet. There are many online resources with explanations of variograms, variogram calculations, and results of particular data sets.
- Ask a consultant. Although they are usually not free, geostatistical consultants are perhaps the best source of geostatistical advice.
Menu commands:
| Select... | to... |
|---|---|
| Geostatistics > Variogram modelling | open the Variogram Modelling Window. |
| From the Variogram Modelling Window: | |
| File > Open > Variogram | open an existing variogram. |
| Variogram > Variogram model type > Exponential | create an exponential variogram model. |
| Variogram > Variogram model type > Gaussian | create a gaussian variogram model. |
| Variogram > Delete structure | remove a variogram model. |
| Variogram > Variogram model type > Hole Effect | create a model that accounts for hole effect. |