


Model validation
Overview
An important step in a geostatistical evaluation is to validate the model after it has been created.
You will learn about:
- comparing cross-sectional data with model values
- grade-tonnage curves from block model reports
- basic statistics of model values
- trend analysis
Requirements
In order to understand this information, you should understand the following concepts:
- Surpac string files
- Surpac block models
- isotropy and anisotropy
- anisotropy ellipsoid
- ordinary kriging
Comparing raw data to estimated values
One method of validating a model is to view cross-sections of it compared to other data.
Task: Comparing raw data to estimated values
- Run 2d_10a_validation_section.tcl.
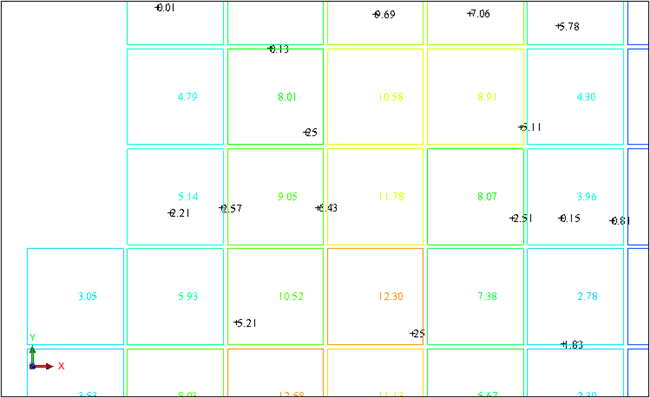
You want to ensure that the values in the model appear to be correct. In this example, this does appear to be the correct where there is significant influence from high sample values due to the low number of samples for kriging.
Grade-tonnage curves
Another means of validating a model is to report tonnes and grade and construct a grade-tonnage curve.
Task: Create grade-tonnage curves
- Run 2d_10b_grade_tonnage.tcl.
- Click Apply on each of the forms displayed.
This macro performs block model reporting to create a *.csv file containing grade and tonnage. A pre-defined *.xls file is displayed at the end with a graph of the grade-tonnage curve.
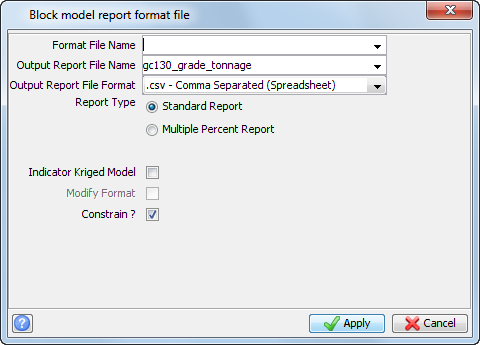
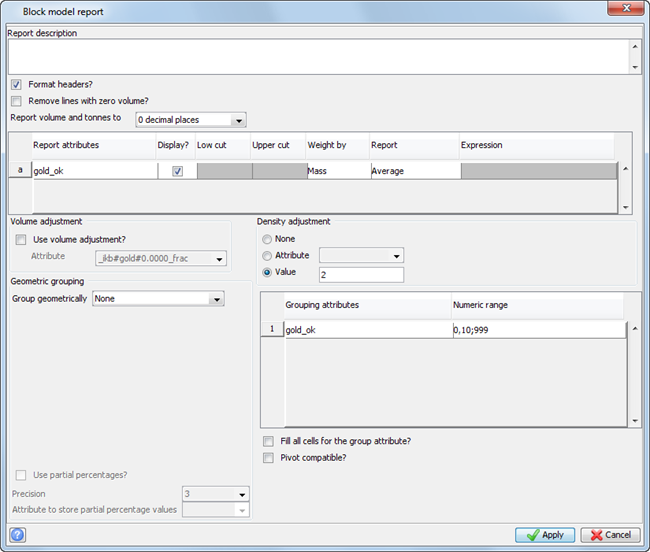
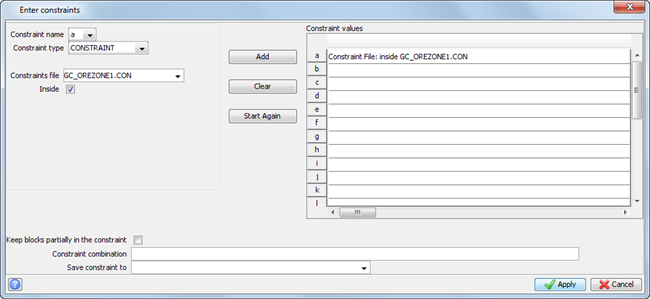
The file gc_130_grade_tonnage.csv is created.
The Grade-Tonnage curve is displayed.
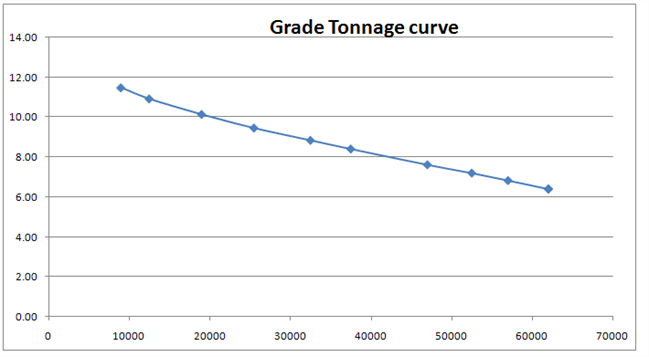
 Note: gc_130_grade_tonnage.xls has been prepared from the output data.
Basic statistics of model values
Basic statistics of the block model values is another way to validate the output from the model.
Task: Display block statistics of model values
- Run the macro 2d_10c_model_stats.tcl.
- Click Apply on the three following forms.
- Click Apply on the following form.
- Click Apply on the following form.
Note: This macro displays basic statistics on three block model parameters.

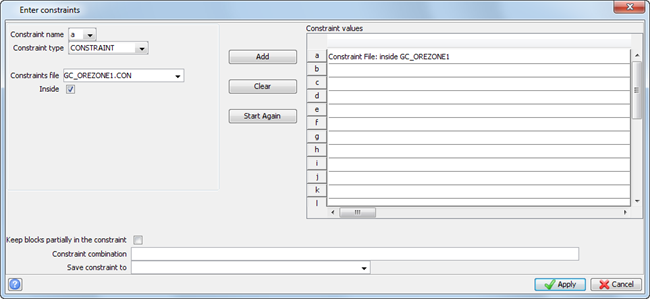
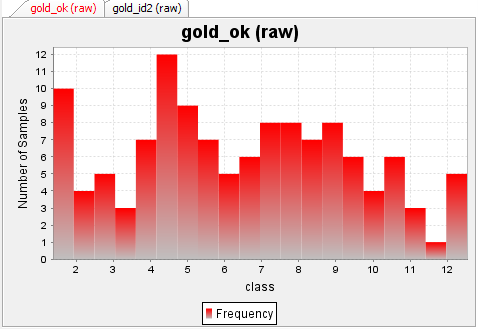
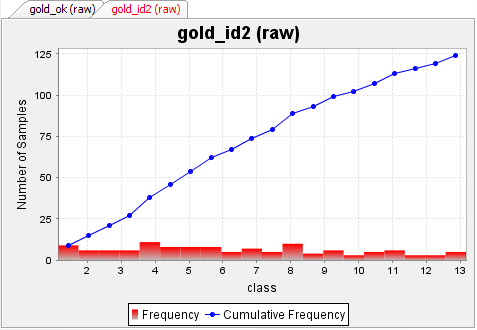
Two histograms of the data are displayed.
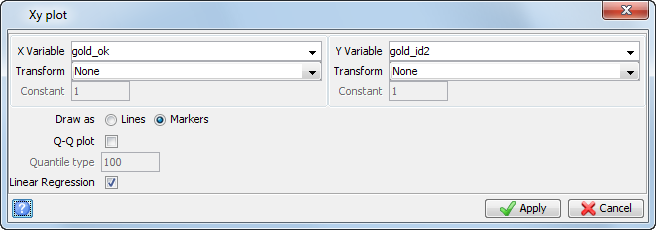
A scatter plot of the inverse distance and ordinary kriged data is plotted with a line of regression showing the correlation between the two data sets.
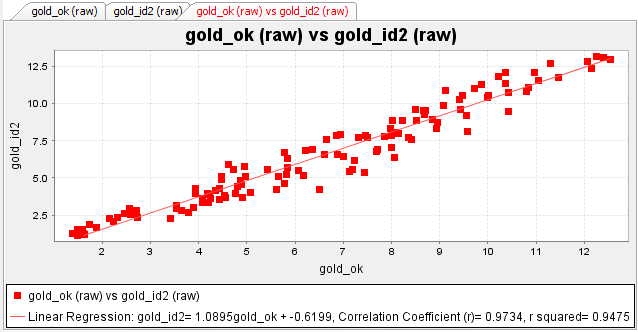
The validity of the result is determined by the degree of correlation between the two data sets. In this case, the correlation is close to 1, so the results are considered valid.
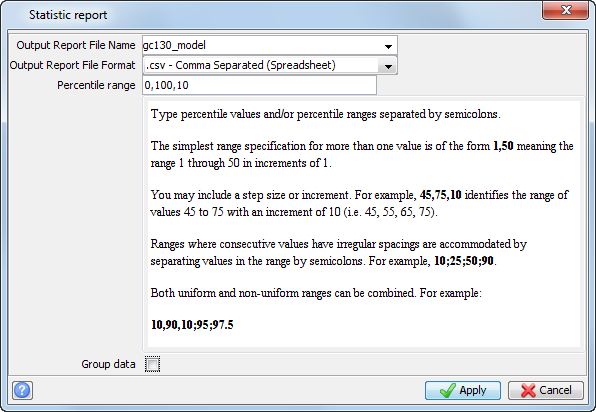
A report of the statistics is saved as a .csv file.