


Indicator kriging
Indicator kriging is ordinary kriging of indicator-transformed data values for each of several cutoffs. The result of performing indicator kriging is a Cumulative Frequency Function (CFF), stored as attributes in the block model. In this way, indicator kriging is not creating a single value for the entire block, but rather describing the amount of material in the block above or below a given cutoff.
You must have previously created and documented variogram models and anisotropy parameters, such as as shown in the following table for this two-dimensional example.
| Cutoff | Variogram | Bearing | Major/Semi-Major Anisotropy Ratio |
|---|---|---|---|
| 1 | cutoff10.vgm | 0 | 2.0 |
| 2.5 | cutoff25.vgm | 22.5 | 3.0 |
| 5 | cutoff50.vgm | 22.5 | 2.3 |
| 10 | cutoff100.vgm | 0 | 2.1 |
For a three-dimensional example, you would have one additional column for major/minor anisotropy ratio.
Task: Perform indicator kriging
- Choose Indicator kriging > Indicator kriging attribute ().
- Enter the information as shown, and click Apply.
- Choose Indicator kriging > Indicator kriging.
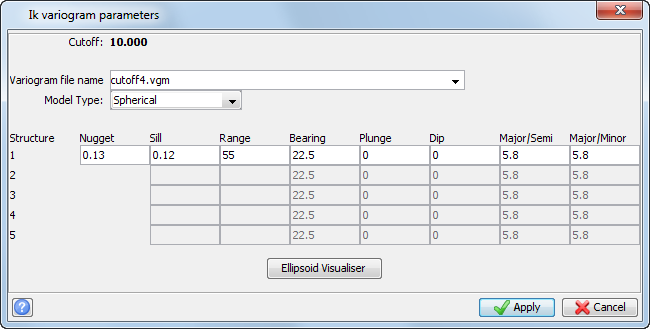
- Enter the information as shown on each of the six following forms, and click Apply.
- Choose Display > Display block model.
- Enter the information as shown, and click Apply.
- Open gc_orezone1.con in Graphics.
- Choose Attributes > View attributes for one block.
- Select a block, to see its attributes.
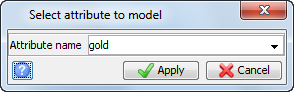
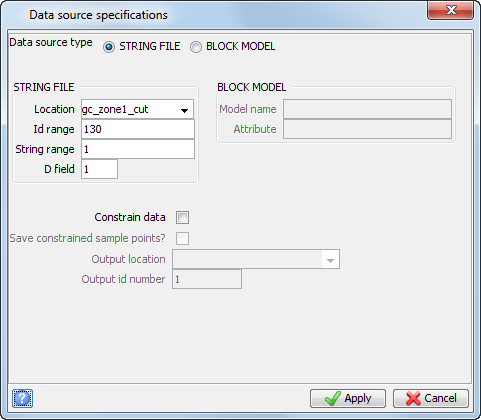
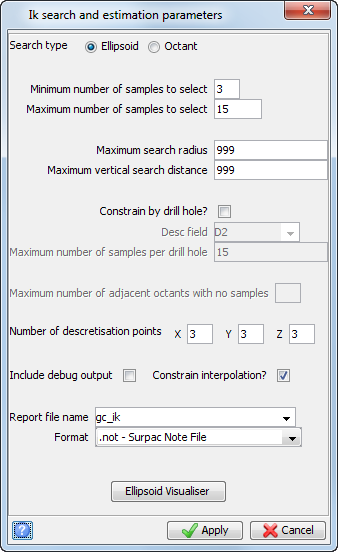
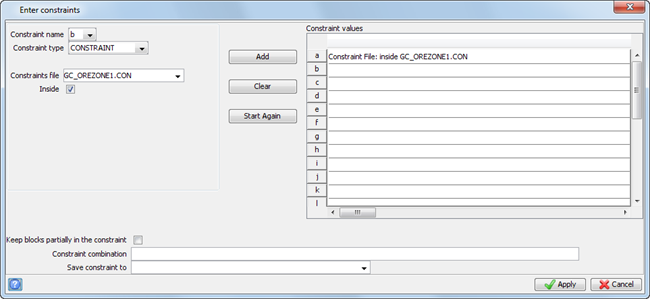
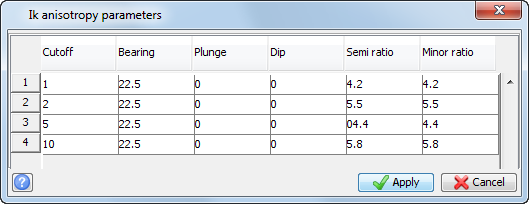
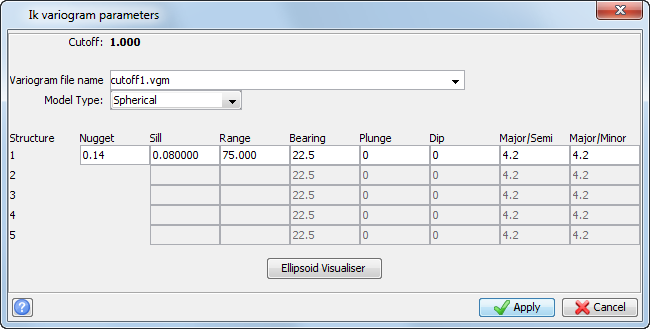
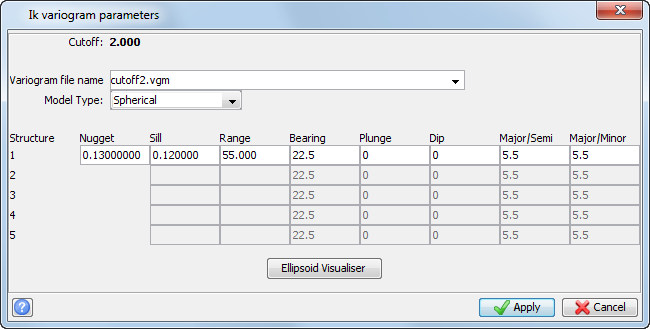
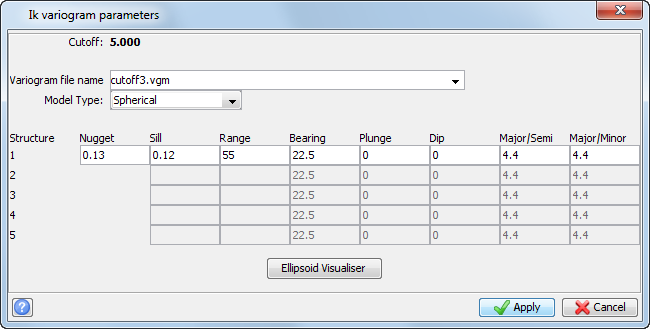

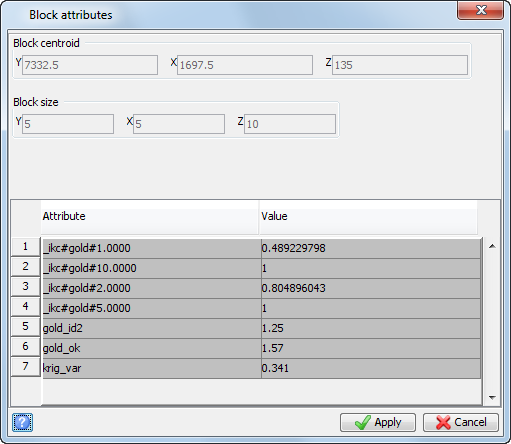
The Cumulative Frequency Function (CFF) values have been estimated. New attributes have been created to store the CFF values, and are named _ikc#IKattribute#cutoff. In the image above, the value of 0.14 for the attribute _ikc#gold#5.0000 indicates that 14% of the block is estimated to fall below the value of 5.0.
 Note: To see all of the steps performed in this task, run 2d_11e_ik_cff.tcl
Task: Calculate block values
- Choose Indicator kriging > Block value estimates
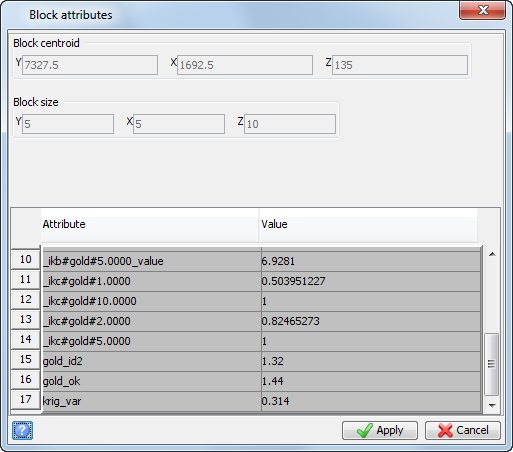
- Enter the information as shown on each of the four following forms, and click Apply.
- On the Verify creation of file form, click Yes.
- Choose Attributes View attributes for one block.
- Select a block.
-
- Click Cancel.
- Choose Display > Colour model by attribute.
- In the Attribute to colour by field, select gold_ok, click Scan, for the Ranges for colour selectiontype 0,15,1 and click Refresh.
- Click Apply.
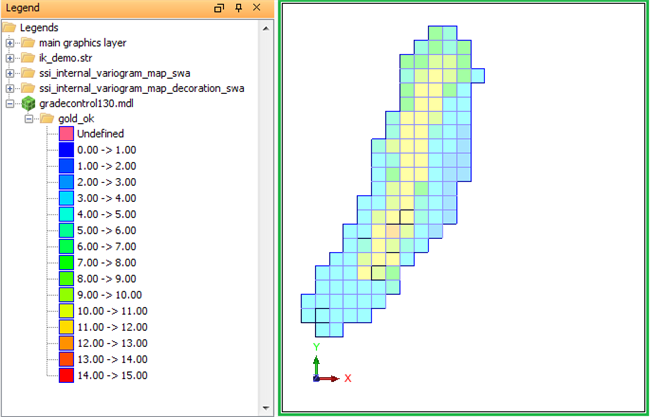
- Display the legend on the Legend tab.
- Choose Block Model > Close, and click Yes.
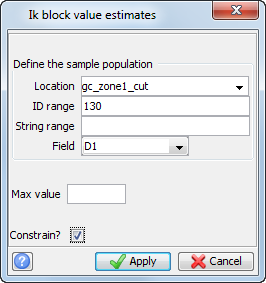
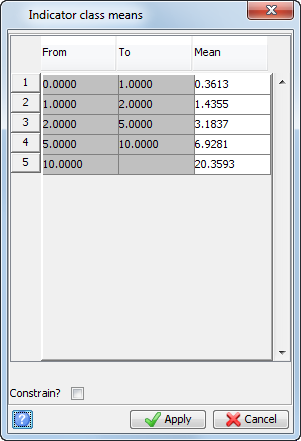
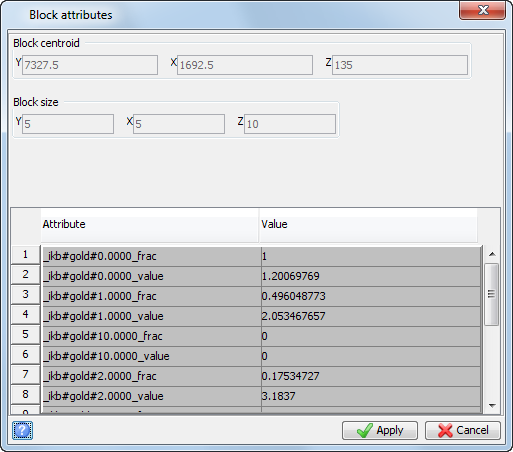
The block values have been calculated. Two new attributes have been created for each cutoff.
_ikb#IKattribute#cutoff_frac - the fraction of the block above the cutoff
_ikb#IKattribute#cutoff_value - the average grade of the block above that cutoff.
In addition, two other attributes are created.
_ikb#IKattribute#0.0000_frac - this will always be 1.00 = 100% of the block
_ikb#IKattribute#0.0000_value - the average grade of the entire block.
In the image above, the value of 13.45 for the attribute _ikb#gold#0.0000 indicates that the average grade of the entire block is 13.45.
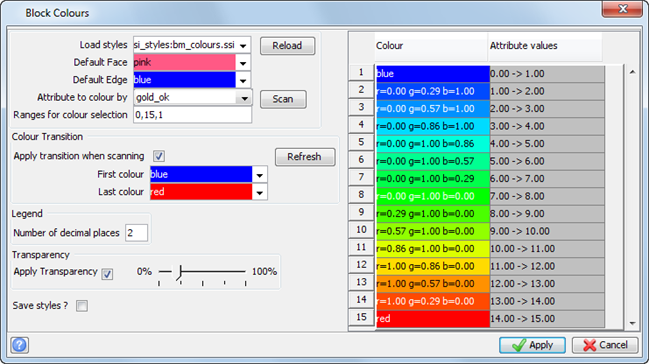
The data and model are displayed, as shown.
Task: Report tonnes and grade for an indicator kriged (IK) model
- Choose Block model > Report.
- Enter the information as shown on each of the five following forms, and click Apply.
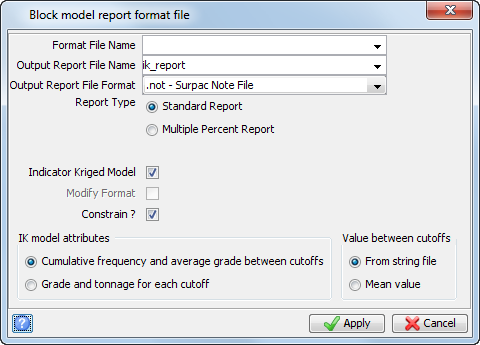
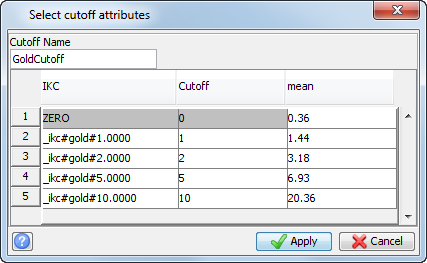
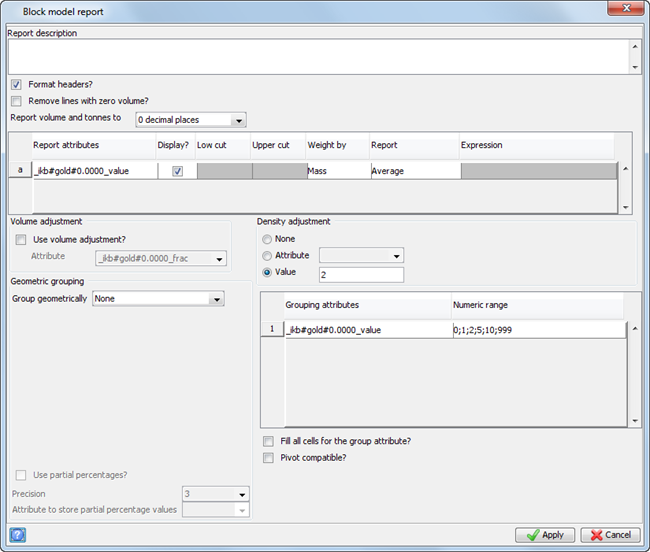
The block model report opens in your default text editor.
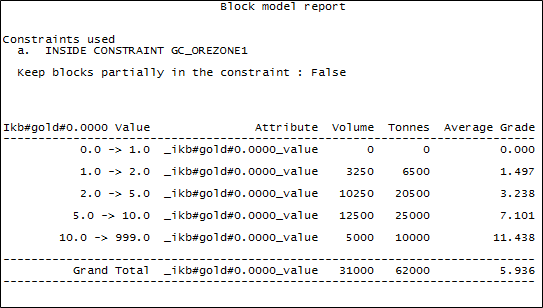
Note: To see all of the steps performed in this task, run 2d_11g_ik_report.tcl. You need to click Apply on any forms presented.