


Drillhole sections
Creating sections graphically
Task: Create sections graphically
 Note: This task requires that you have successfully performed the previous task so that the drillholes are displayed correctly. If you did not successfully display the drillholes in the last task, run the macro
03c_display_drillholes_with_styles.tcl.
Note: This task requires that you have successfully performed the previous task so that the drillholes are displayed correctly. If you did not successfully display the drillholes in the last task, run the macro
03c_display_drillholes_with_styles.tcl.
- Choose Section > Define.
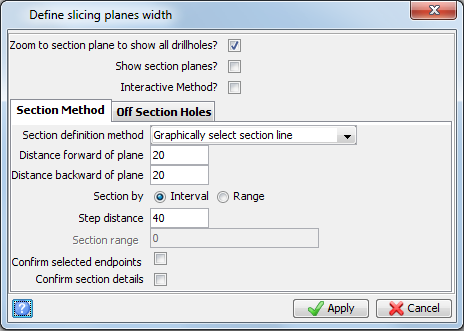
- Enter the information as shown, and click Apply.
- Select your section; click and hold the cursor and drag to a point as shown.
- Click Next section
 , to move through the sections.
 - Rotate the section.
- Click End section mode
 .
.
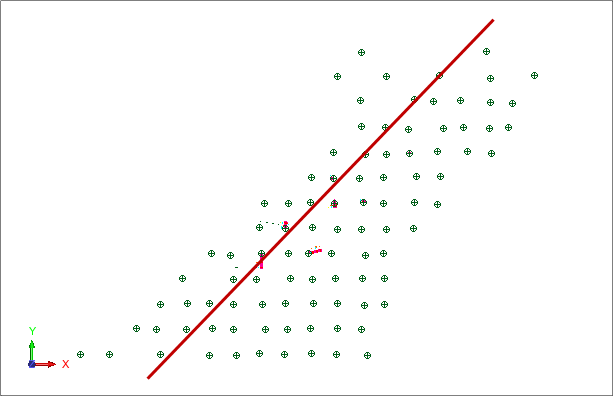
A result similar to the following is displayed.
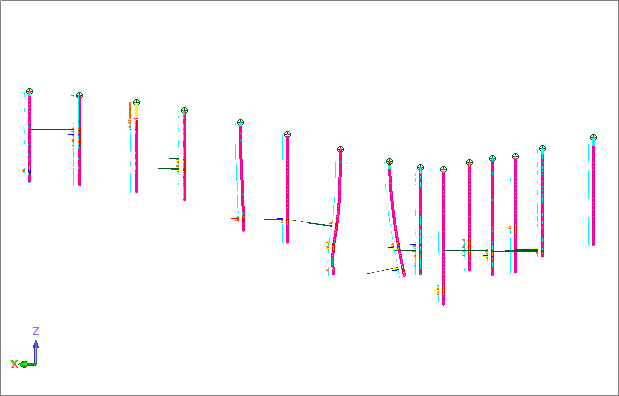
 Tip: If you want to go back to the zoom plane, choose View > Zoom > Zoom plane.
Note: To see all of the steps in this task, run macro
04a_create_sections_graphically.tcl. You need to Apply any forms
presented.
Advanced cross-sectional viewing
You can use Surpac to generate a sequence of string slices from DTM or 3DM objects and resident block models, as well as the drillhole database.
Task: Create viewing planes including DTMS and 3DMS
- Run macro 03c_display_drillhole_with_styles.tcl.
- Open topo1.dtm, pit1.dtm and ore1.dtm in Graphics.
- Click Section view.
- Use the transparency slider toolbar to view the data through these rendered surfaces.
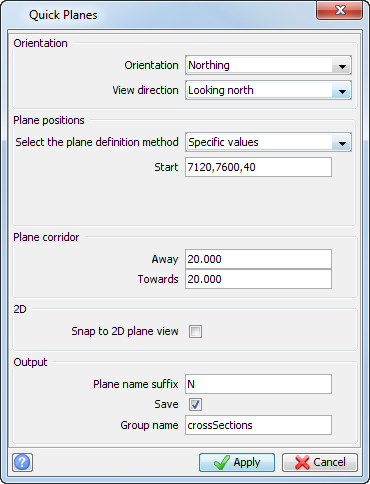
- Choose Planes > Quick planes.
- Enter the information as shown, and click Apply.
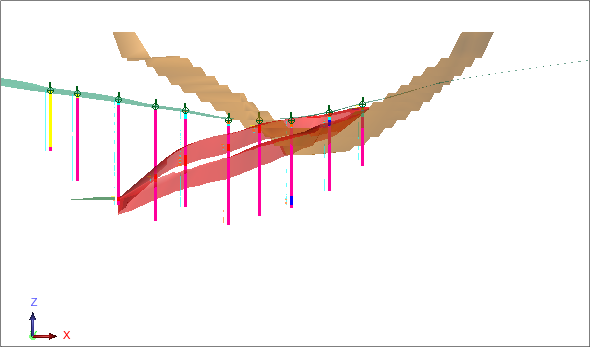
- In the Planes panel, click Next plane to move through all of the sections.
The surfaces, solid, and drill holes are displayed.
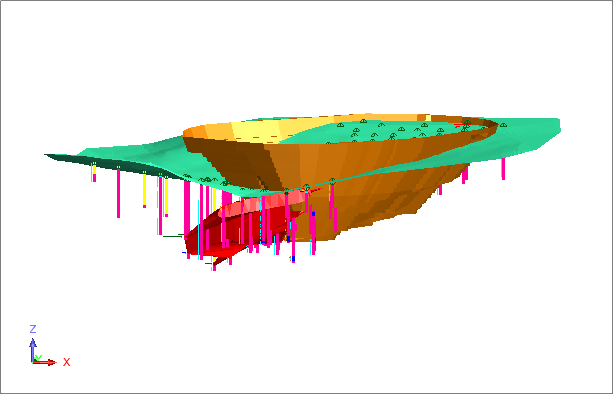

Note: To make the transparency slider toolbar available, right-click in the empty space next to the menus, choose Toolbars, and then select Scale and transparency.
Note: To see all of the steps in this task, run macro
04b_advanced_cross_sectional_viewing.tcl . You need to Apply any forms
presented.
Viewing regular sections
Task: View regular sections
- Click the Reset graphics icon
 .
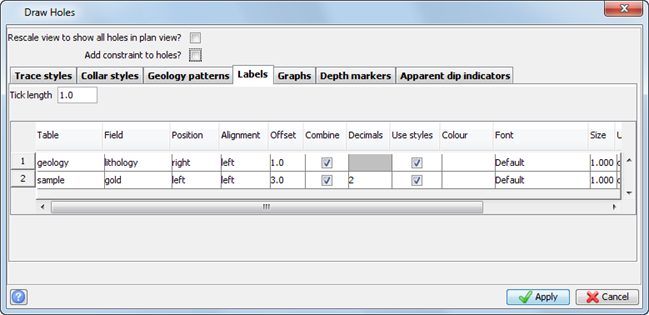
. - Choose Display > Drillholes.
- Enter the information as shown, and click Apply.
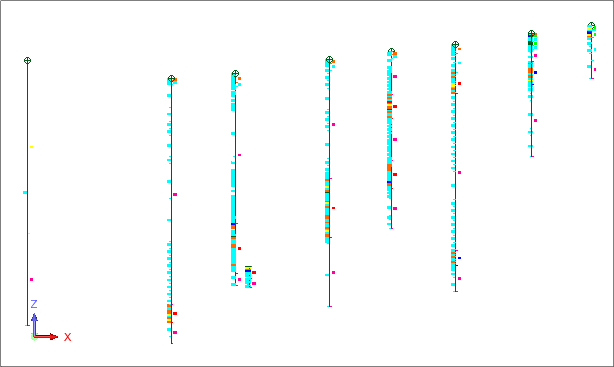
- In the Planes panel, double-click 7120N in the crossSection group.
- Press F12 to move through each viewing section.
Note: To see all of the steps in this task, run
04c_create_regular_sections.tcl.
You need to Apply any forms
presented.
Digitising an ore outline
Task: Digitise an ore outline
- Run macro 04c_create_regular_sections.tcl.
- In the Planes panel, double-click 7280N in the crossSections group.
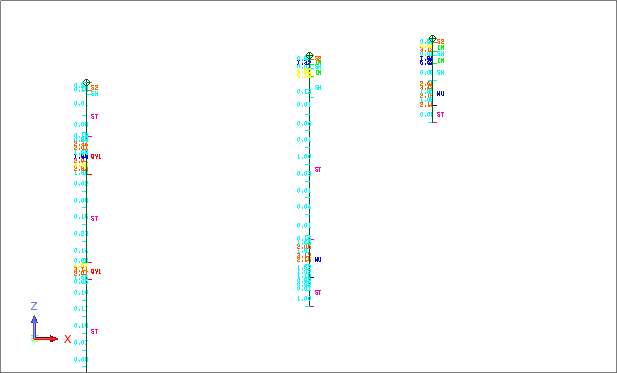
- Zoom in on the area of interest as shown:
- Choose Create > Digitise > Properties.
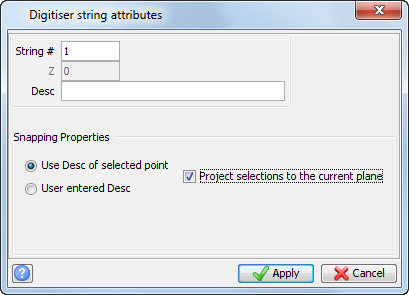
- Enter the information as shown, and click Apply.
- In the Layers pane, click New.
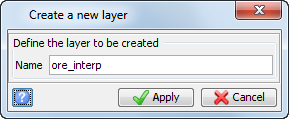
- Enter the information as shown, and click Apply.
- Choose Create > Digitise > New point.
- Digitise some end points for the ore zone by clicking the points as shown.
- Right-click and choose Point.
- Click the drillhole at the lower boundary of the MU zone.
- Click at the lower boundary of the MU zone in the next drillhole as shown.
- Zoom or window out to see the area of interest as shown.
- Right-click and select New midpoint
 .
.
- Click the point you have just digitised at the bottom of the MU zone on the middle drillhole.
- Click at the bottom of the drillhole to the left.
- Click a point at the top of the ST zone on the left most drillhole.
- Click a point at the top of the MU zone on the middle drillhole.
- Zoom or window out to see the area of interest.
- Right-click and choose New point
 .
.
- Click at the top of the MU zone on the middle drillhole.
- Click at the top of the MU zone on the right most drillhole.
- Right-click and choose Close segment
 .
. - Choose File > Save > string/DTM.
- Enter the information as shown, and click Apply.
Note: If you select the
Project selections to the current plane check box, all values will be the same for that section plane, in this case the northing (Y coordinate). If you clear this check box, points that are snapped to drillholes will have the coordinates of that point, while digitised points between holes will snap to the plane of the section.
This creates a layer called "ore_interp" to store the new data you are digitising.
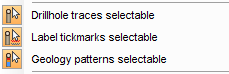
The following options can be seen under the Database > Display menu.
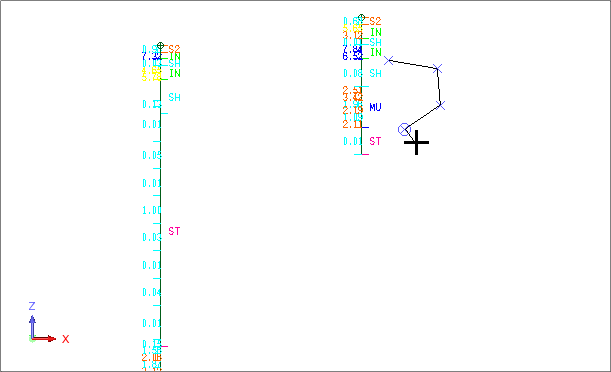
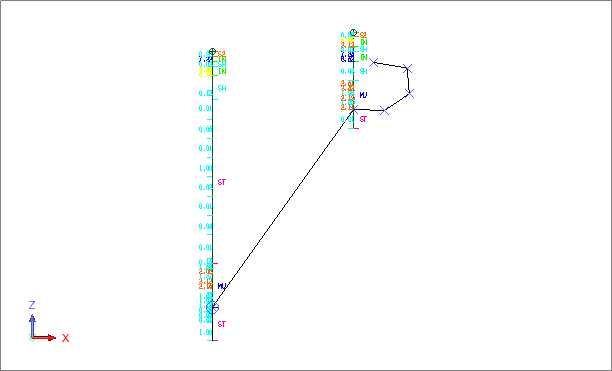
The next two points are generated using the New midpoint function. To do this, you need to zoom out so that you can see the next drillhole on the left.
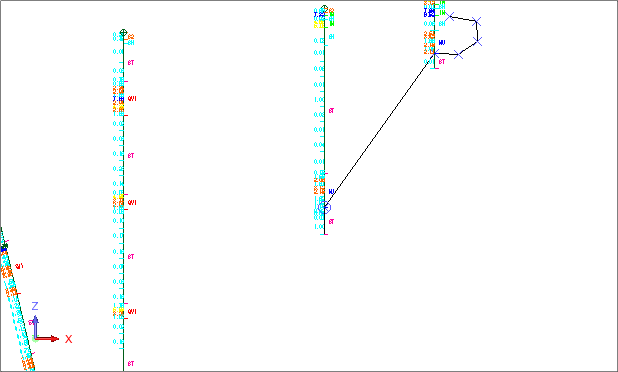
A point is created midway between the two selected points.
A point is created midway between the two selected points as shown.
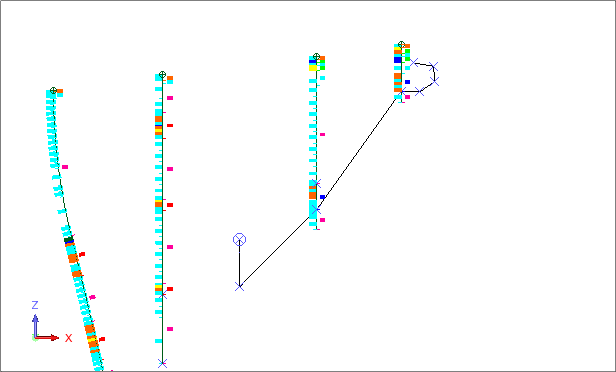
The result will be similar to the following.
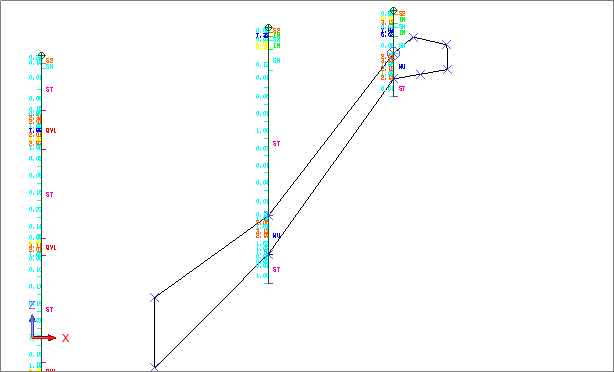
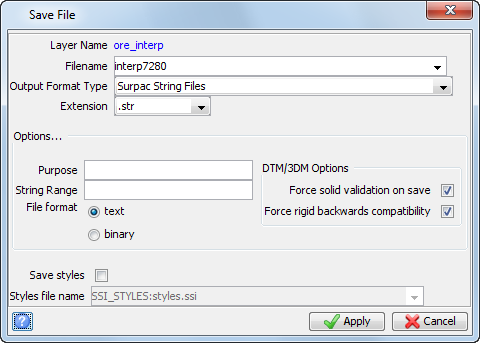
Tip: While it is not necessary to save until the end, it is recommended to save your data throughout the working session.
Note: To see all of the steps in this task, run macro 04d_digitising_ore_outline.tcl. You
need to Apply any forms presented.
Flagging an interval table
You will now look at flagging an interval table with 3DM intercepts.
In the previous section, you modelled an ore zone. After modelling an ore zone you might want to carry out some statistical analysis on the data to determine sample populations, to then use the composited data to estimate the block model.
It is good practice to call the table intersect and create a new character field called flag. This table can then be used to store drillhole intercepts that pass through the 3DM ore envelopes.
Task: Flag an interval table
- Choose Database > Administration > Create table.
- Enter the information as shown, and click Apply.
- Enter the information as shown, and click Apply.
- Open ore1.dtm.
- Choose Analysis > Drillhole 3DM intersection.
- Click Apply to choose no query constraints.
- Enter the information as shown.
- Close the database.
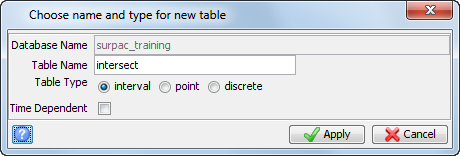
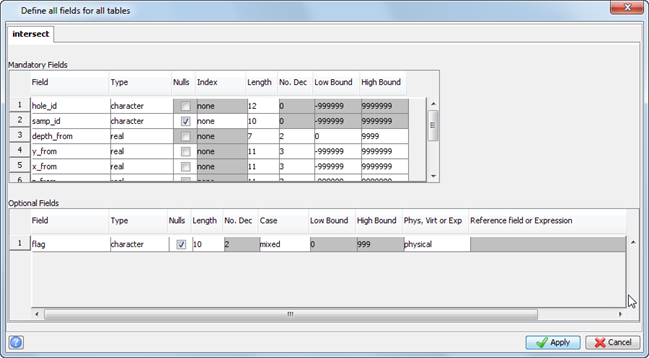

Note: At the top of the form is an object pick list. Surpac lists all objects resident in the active layer. If there is more than one object, you have to intersect each object separately.
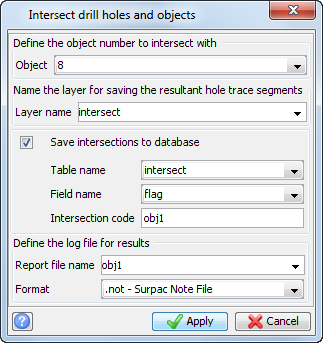
Note: You need to type in the layer name (intersect) on the form.
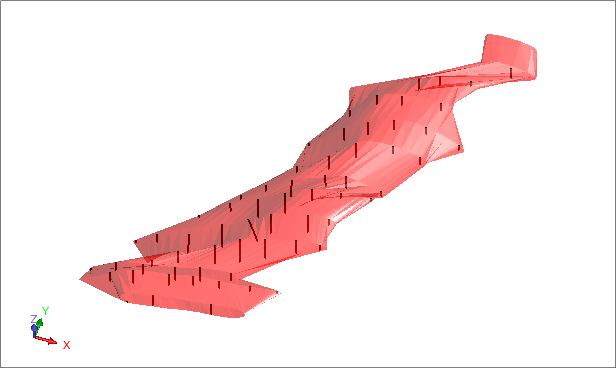
Any drill holes that pass through object 8 are written to the intersect table.
A new layer is also created to show the intercepts that pass through the 3DM, as shown in the following image. It is not necessary to save this information. You can use it as a graphical check to make sure an intercept has been generated for all drillholes passing through the 3DM.
You have now flagged the grade intervals to composite for statistical analysis, compositing, and block model filling.
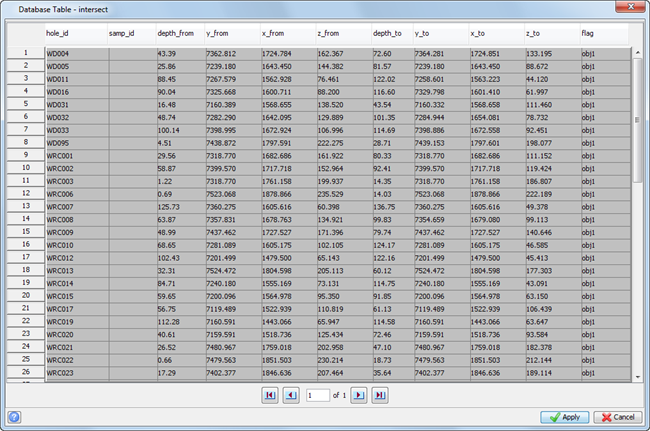
Note: The new Intersect table does not contain any grades, only the locations of the grades in the assay table. It can be used as a defined Zone when you extract composites from the database.
Note: To see all of the steps in this task, run the macro
04e_create_flag_table.tcl. You
need to Apply any forms presented. You need to use Edit > View table after running the macro to see the Intersect data.
Determining the grade of a digitised segment
When a segment has been digitised on a section, the grade for that segment can be calculated using the Digitised segment grade function.
Task: Determine the grade of a digitised segment
- Open section_7320_north.swa.
- Choose Sections > Digitised segment grade.
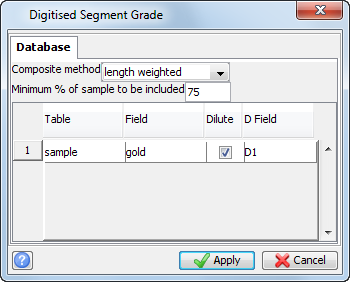
- Enter the information as shown, and click Apply.
- Click the segment.
- Press ESC.
- Choose Inquire > Point properties and click any point on the segment.
- Press ESC.
- Close the database.
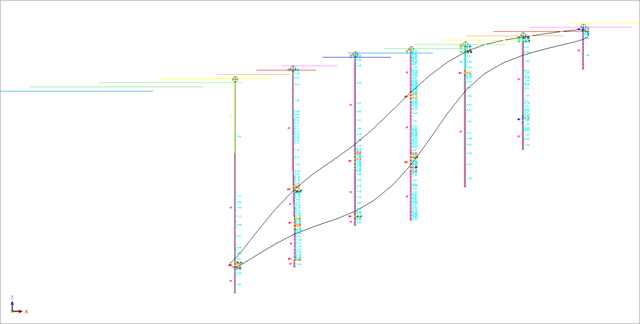
The results are displayed in the message window.
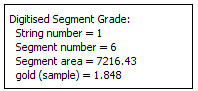
The point properties are displayed in the message window. The segment grade is written in the D1 field.

Note: To see all of the steps in this section, run macro 04f_determine_segment_grade.tcl. You
will need to click Apply on any forms presented.