Domains
One of the most important aspects of geostatistics is to ensure that any data set is correctly classified into a set of homogenous "domains". A domain is either a 2D or 3D region within which all data is related. Mixing data from more than one domain or not classifying data into correct domains can often be the source of estimation errors.
A simple example
Imagine that you are a meteorologist, and you are given three air temperatures measured at locations A, B, and C, as displayed below. Based on the values shown, what would you guess the temperature is at location X? Would you guess that the temperature at location X was greater than 25?
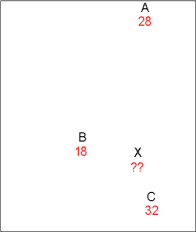
Using the information above, you may have the following thoughts:
- Because location A is relatively distant from X, the value at A may have little or no influence on the estimated temperature at X.
- Because locations B and C are about the same distance from X, they will probably have equal influence on the estimated temperature.
- Given the previous two points, the temperature at X would probably be the average of the temperatures at B and C: (18 + 32) / 2 = 25 degrees
- Because the influence of A has not been accounted for at all, and the estimate is exactly 25 degrees, it is difficult to say with certainty if the temperature at X is above 25 degrees.
Now consider the following. Imagine that you want to go to your favourite beach, but only if the temperature is 25 degrees or more. You have three friends who live near the beach you want to go to, and you call them up and ask each one what the temperature is at each of their homes. You draw the map below, with the locations of each friend (A, B, and C) and the temperatures they give you. Your favourite beach is at location X. Note that the friend at location B lives high up in the mountains, while friends at A and C live near the beach.
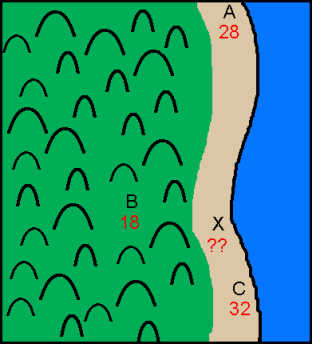
Using the information above, you may have the following thoughts:
- The data from B can be ignored, because temperatures high up in the mountains are usually not good estimates of temperatures on the beach.
- A and C are on the beach, so they can be used to guess the temperature at X.
- Because X is between A and C on the map, the temperature at X will probably be somewhere between the temperature at A and the temperature at C.
- Therefore, the temperature at X will be somewhere between 28 and 32 degrees
- Because the temperature range of 28 to 32 degrees is greater than the minimum value of 25 degrees, you would probably decide “Yes, I’m going to the beach!”
Compare this example with the first one. In both cases, all of the locations and temperatures are exactly the same. However, in the second case, when you took account of the domain which contains the data, you came up with a considerably different result. The point is that separating data into similar regions, or domains, is a very important part of making any geostatistical estimation.
Viewing domains in Surpac
Task: View domains in Surpac
- Open all_composites2.str.
- Choose Display > Hide everything.
- Choose Display > Point > Markers.
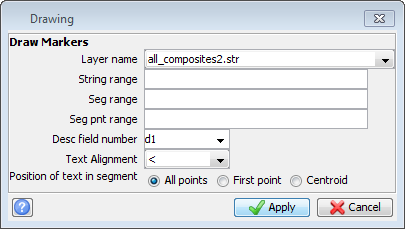
- Enter the information as shown, and click Apply.
- Choose Display > 3D grid.
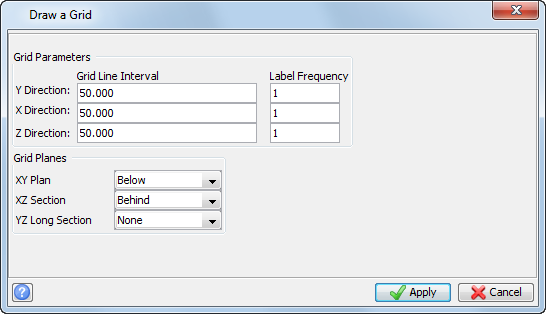
- Enter the information as shown, and click Apply.
- Use the left mouse button to rotate the view.
- With all_composites2.str displayed, open ore1.dtm.
The composites are displayed. The points in this string file represent 2 metre downhole composites. The D1 field contains the composited value for gold. The D1 values have been used to classify the points into different strings.
|
String |
D1 |
|---|---|
|
1 |
< 1.000 |
|
2 |
1 – 1.999 |
|
3 |
2 – 2.999 |
|
4 |
3 –3.999 |
|
5 |
4 – 4.999 |
|
6 |
5 – 5.999 |
|
7 |
>= 6.000 |
As in the first example, any estimation that you would make with only this file would be based only on the distances between the sample points and the estimated location.
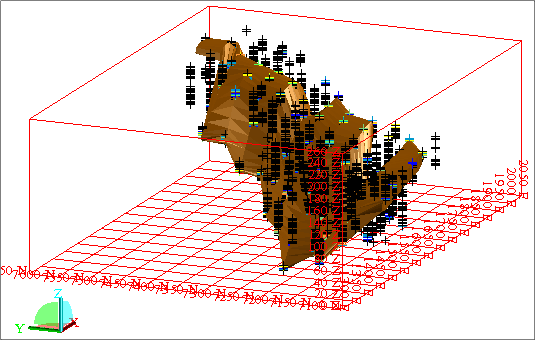
This solid represents a single domain, as interpreted by a geologist. Only composites which are inside this domain should be used to estimate points inside the domain.
Extracting data with a domain in Surpac
Task: Extract data with a domain in Surpac
The domain ore1.dtm represents an ore zone known as the QV1 zone. You will now go through the process of extracting composites only inside the QV1 domain.
- Run the macro 07_create_downhole_composites.tcl.
- After reading the text below on the first form, click Apply.
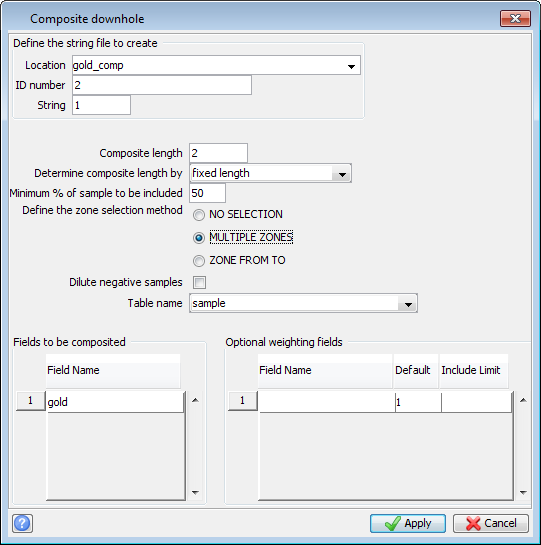
- Enter the information as shown, and click Apply.
- After viewing the form, click Apply.
- After reading the text on the next form, click Apply.
|
A geostatistical analysis of data in a drillhole database generally starts with compositing a sample value within a given geological zone.
In this example, we will be creating 2 meter downhole composites within the QV1 geological code. |
To run the function COMPOSITE DOWNHOLE you use Composite > Downhole.
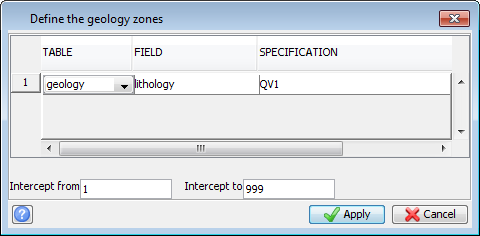
On the next form, the character field lithology exists in the geology table, which is an interval table. The text "QV1" has been inserted into the field lithology for every interval of a drillhole which is inside ore1.dtm.
|
2 meter downhole composites have been created within the QV1 rock type, and are stored in the D1 field ingold_comp2.str.
String 1 contains composites where 50% to 100% of the 2m length contained a gold value. String 2 contains composites where less than 50% of the 2m length contained a gold value.
Either or both of these strings may be used for further geostatistical analysis. In this example, you will use both strings. |
An east-west section of the database, and the composites which were created, are displayed.