


Display drillholes
Task: Display drillholes
- Connect to surpac_training.ddb.
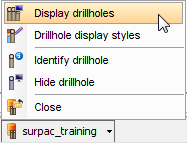
- Click the surpac_traning icon on the Status bar, and select Display drillholes.
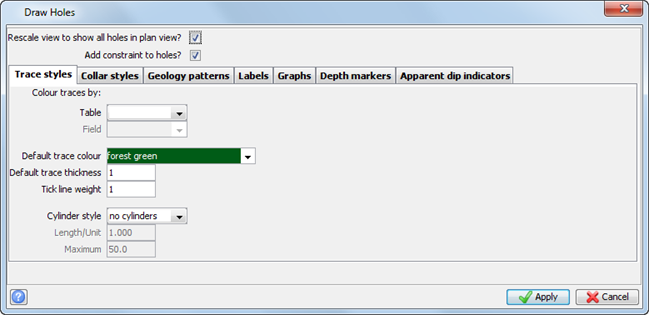
- Enter the information as shown, and click Apply.
- Click Apply.
The Define query constraints form is displayed.

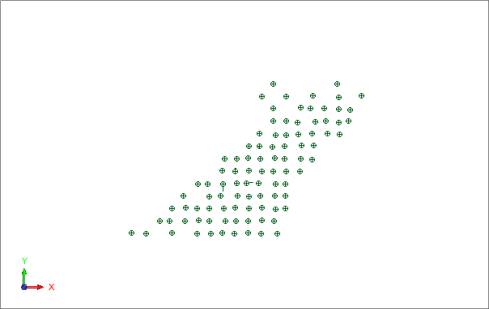
The drillholes are displayed in plan view.
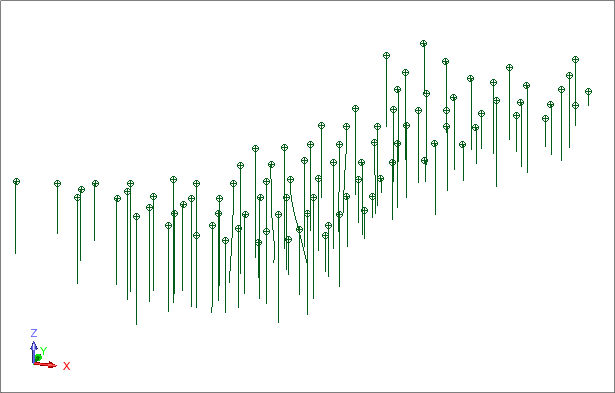
When the drillholes are rotated you can see that despite colouring the traces by assay, everything is green. This is because no styles have been setup to display the data. Next, you create colour display styles for the lithology and assays.
 Note: To see all of the steps in this task, run
03a_display_drillholes_no_styles.tcl.
You need to click Apply on any forms presented.
Note: To see all of the steps in this task, run
03a_display_drillholes_no_styles.tcl.
You need to click Apply on any forms presented.
Task: Apply styles to drillholes
- Choose Display > Drillhole display styles.
- Expand the geology folder and locate the lithology field.
- Right-click on the lithology field and choose Get field codes from the shortcut menu.
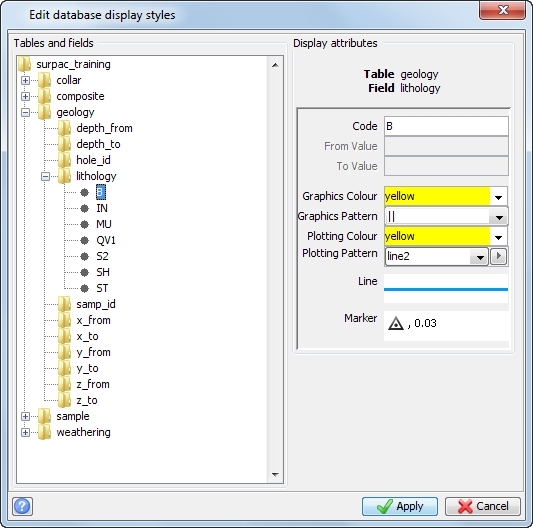
- Expand the lithology folder.
- For each of the 7 lithological codes, select a different colour for Graphics and plotting.
- Expand the sample folder to find the gold field.
- Right-click the gold field and choose Get min – max range from the shortcut menu.
- On the right-hand side, change the From Value to 0, and the To Value to 2.
- Choose a colour for this grade range.
- Right-click on the gold field and choose Add new style from the shortcut menu.
- On the right-hand side, change the From Value to 2, and To Value to 4.
- Choose a colour for this grade range.
- Continue adding grade ranges in increments of 2 until you reach 10.
- Click Apply.
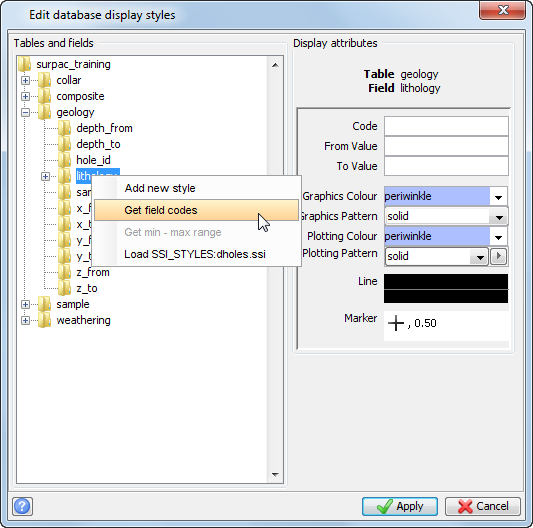
This adds all 7 unique lithological codes to the list.
For example:
| B | Yellow |
| IN | Green |
| MU | Blue |
| QV1 | Red |
| S2 | Orange |
| SH | Cyan |
| ST | Magenta |
Codes can be grouped together. For example, if there was a series of codes beginning with the letter M, they could be all coded purple. Or, relating to the lithology example, S* Orange, would mean that S2, SH and ST would all plot in orange.
| M* | Purple |
| S* | Orange |
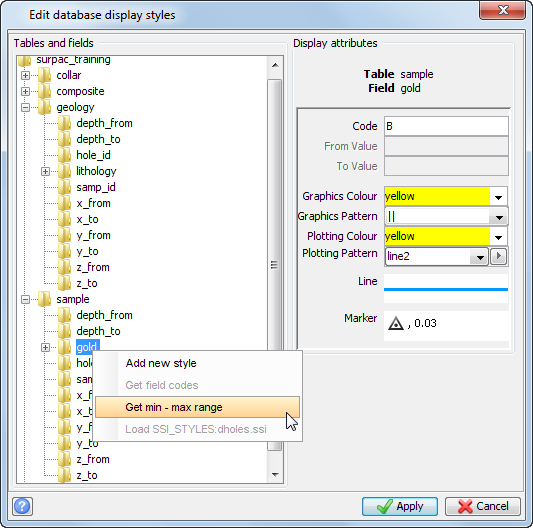
This adds one grade range that consists of the minimum and maximum values found in the gold field. This provides you with a reference of the range of values currently available in that field.
This adds a new range below the previous range.
For example:
| 0-2 | Cyan |
| 2-4 | Orange |
| 4-6 | Yellow |
| 6-8 | Blue |
| 8-10 | Red |