Compositing
Compositing by elevation
Task: Perform composite by elevation
You can use this function to create one or more string files which contain elevation composites of sample data. The composites can be weighted by length alone or by other fields in the table containing the sample data including specific gravity and recovery.
- Connect to surpac_training.ddb.
- Choose Composite > Bench elevations.
- Enter the information as shown, and click Apply.
- Enter the information as shown, and click Apply.
- Open benchcomp100.str in Graphics.
- Choose Display > Hide everything.
- Choose Display > Point > Markers.
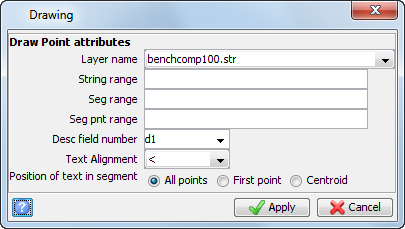
- Enter the information as shown, and click Apply.
- Choose Display > Point > Attributes.
- Enter the information as shown, and click Apply.
Drill Holes are processed as described below:
All samples, or fractions of samples, of the drill hole, which are within the nominated elevations for the composite, are reduced to a single point value. This value has the length-weighted average of all samples that intersected the elevation range of interest.
If the total vertical length of the samples, as a percentage of the vertical height of the elevation bounds of the composite, is less than a defined threshold percentage, the hole is ignored. This gives you some control over whether drill holes which only partially intersect the elevation composite are included or excluded from the final result.
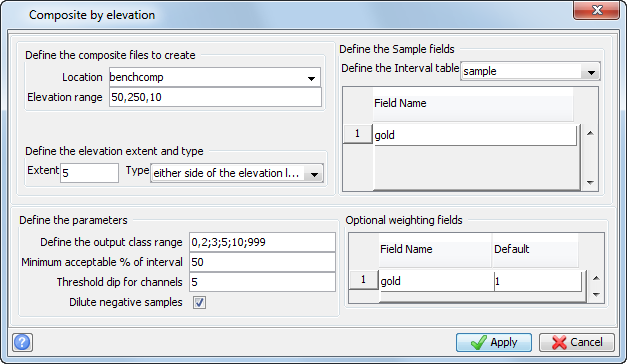
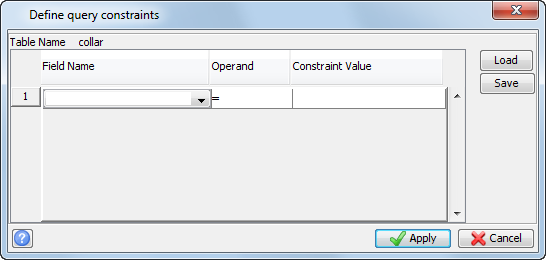
A set of string files is produced called benchcomp50.str, benchcomp60.str in increments of 10 up to benchcomp240.str.
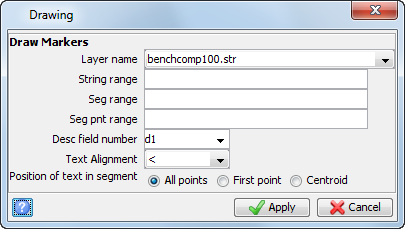
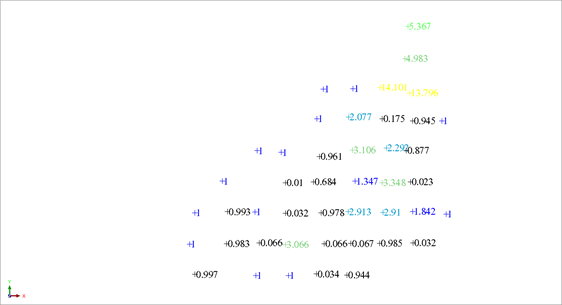
The values of the composites at bench level 100 are displayed.
 Note: To see all of the steps in this task, run
06a_composite_by_elevation.tcl. You
need to Apply any forms presented.
Note: To see all of the steps in this task, run
06a_composite_by_elevation.tcl. You
need to Apply any forms presented.
Compositing downhole
Task: Perform composite downhole
- Choose Composite > Downhole.
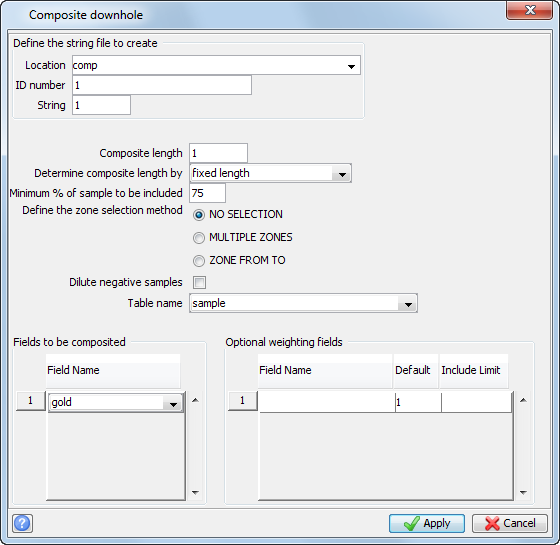
- Enter the information as shown, and click Apply.
- Enter the information as shown, and click Apply.
- Click Reset graphics
 .
. - Open comp1.str in Graphics.
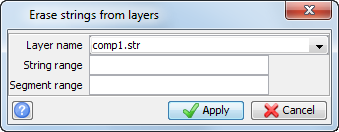
- Choose Display > Hide strings > In a layer.
- Enter the information as shown, and click Apply.
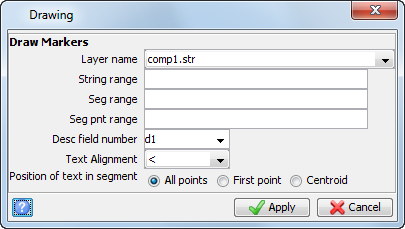
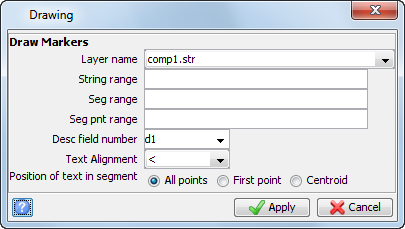
- Choose Display > Point > Markers.
- Enter the information as shown, and click Apply.
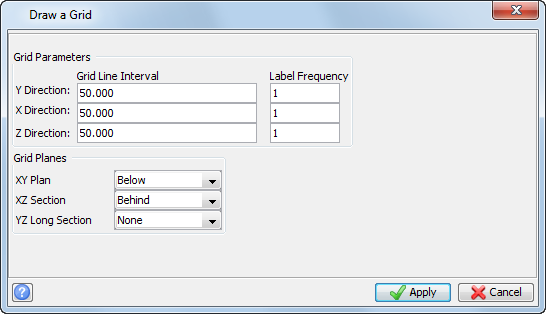
- Choose Display > 3D Grid.
- Enter the information as shown, and click Apply.
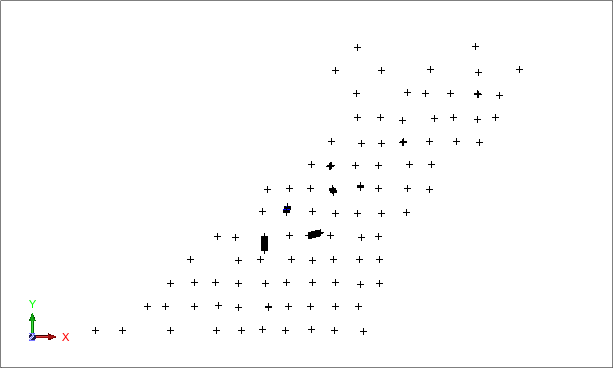
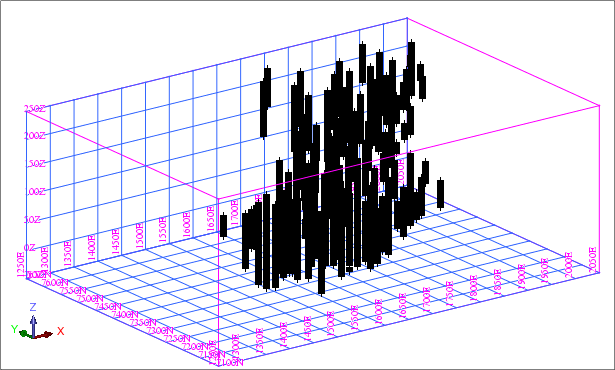
- Zoom in and rotate the data to display the composites.
The composites are displayed.
Note: To see all of the steps in this task, run
06b_composite_downhole.tcl. You need
to Apply any forms presented.
Compositing downhole constrained by intercept table
Task: Perform composite downhole constrained by intercept table
- Choose Composite > Downhole.
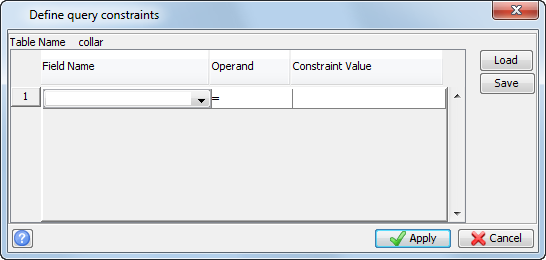
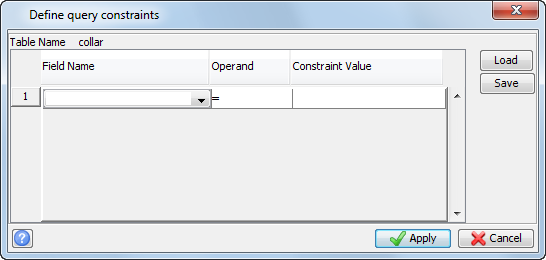
- Enter the information as shown, and click Apply.
- Enter the information as shown, and click Apply.
- Enter the information as shown, and click Apply.
- Click Reset graphics.
- Open comp1.str in Graphics.
- Choose Display > Hide everything.
- Choose Display > Point > Markers.
- Enter the information as shown, and click Apply.
- Choose Display > 3D Grid.
- Enter the information as shown, and click Apply.
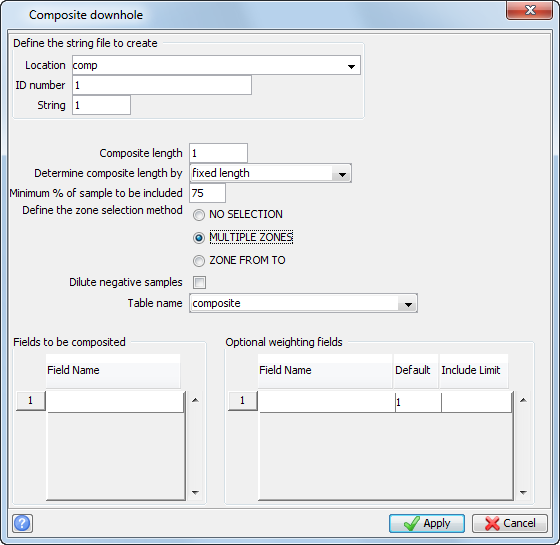
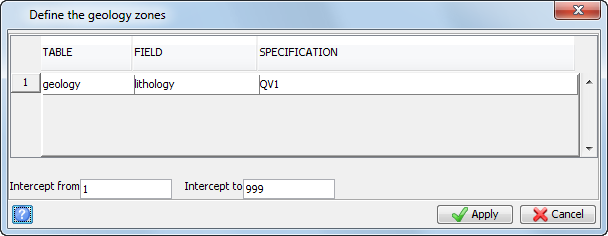
This is where you use the flagged intercepts created and stored in the intersect table. Surpac composites the samples that fall inside the intervals stored in this table.
The composites are displayed.
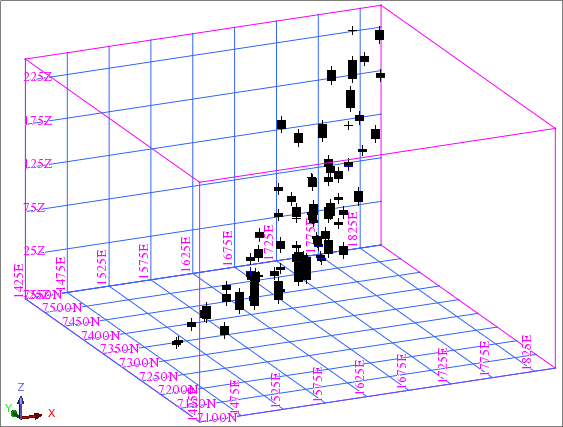
The display shows 1m composite string files inside the 3DM. String 2 contains the composites which did not meet the 75% criteria.
Note: To see all of the steps in this task, run 06c_composite_downhole_constrained_by_intercept.tcl.
You need to click Apply on any forms
presented.
Compositing graphical
Task: Perform composite graphical
- Click Reset graphics.
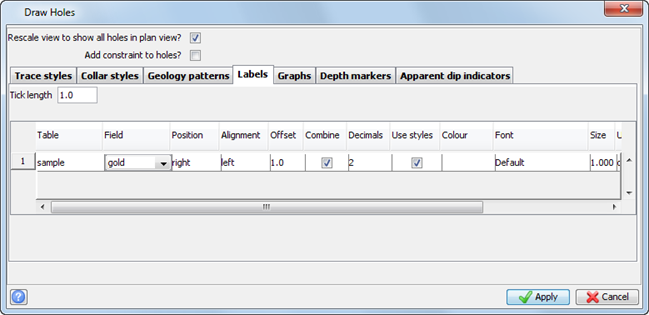
- Choose Display > Drillholes.
- Enter the information as shown, and click Apply.
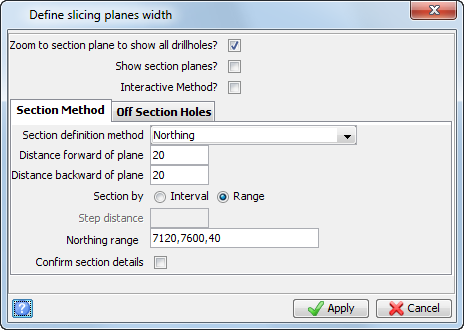
- Choose Sections > Define.
- Enter the information as shown, and click Apply.
- Zoom in on an area of high grade.
- Choose Composite > Setup options.
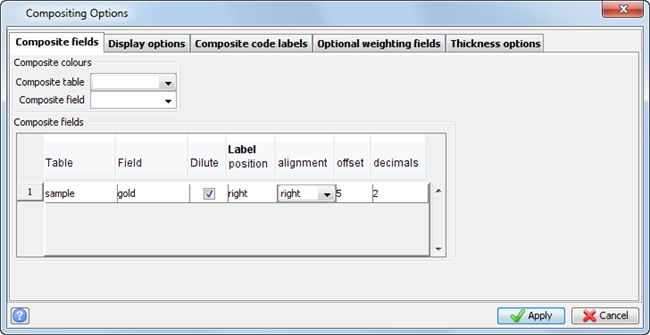
- Enter the information as shown.
- Click the Display options tab and enter the information as shown.
- Click the Composite code labels tab and enter the information as shown.
- Click the Thickness options tab, enter the information as shown, and then click Apply.
- Choose Composite > Create.
- Click the first composite point.
- Click the second composite point.
- Click ESC.
- Choose Composite > Setup options.
- Enter the information as shown, and click Apply.
- Choose Composite > Edit.
- Click the composite.
- Click Cancel.
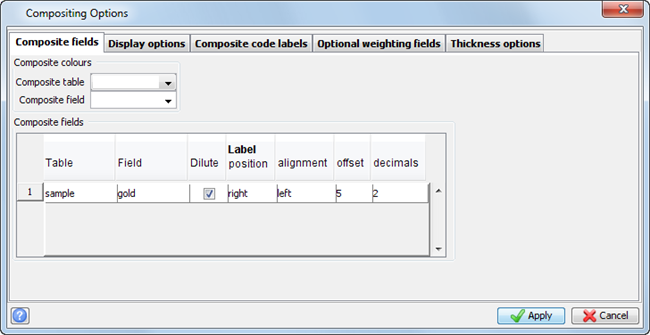
Note: If you select the Dilute check box, negative values or missing samples are treated as zero and will dilute any composite you create. If you do not select this check box, negative values or missing samples are ignored and will not affect the composite.
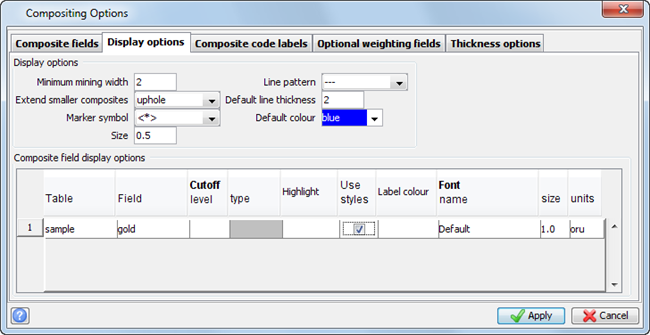
This displays the averaged sample value 1 unit high, as a thick blue trace terminated at each end by diamond shaped markers.
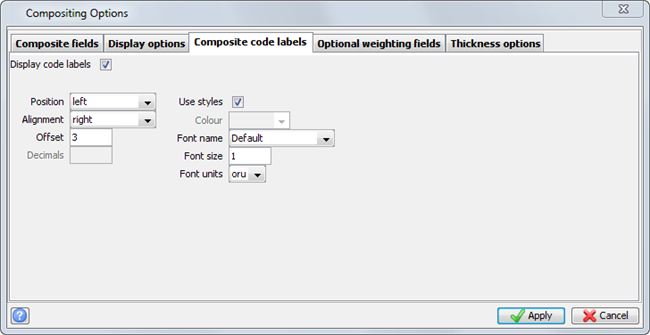
This displays the code labels on the left-hand side of the drillhole trace, one unit high. The code labels are character values that represent an interval; they can be stored in a database table.
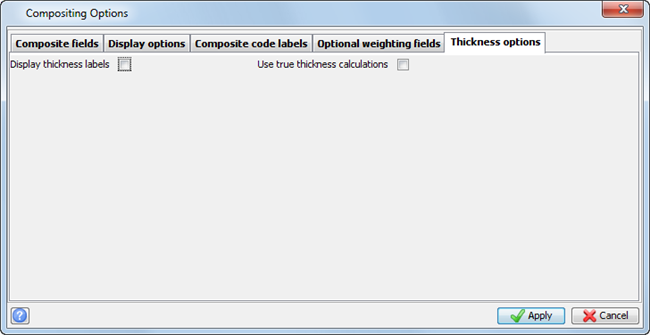
Clearing these options prevents the thickness of the composite displaying in Graphics.
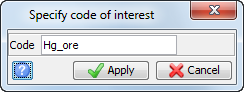
A result similar to the following is displayed.
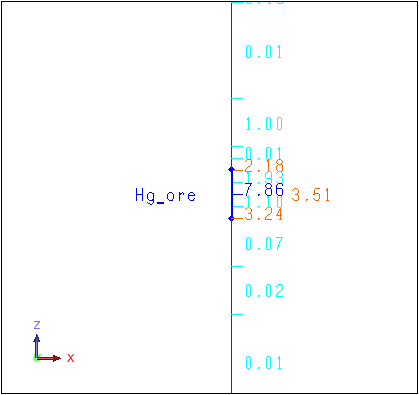
Next, you will view the calculated grade and the exact depth_to and depth_from.
A form similar to the following is displayed.
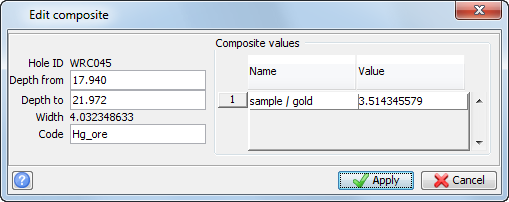
Note: You can also edit the depths to recalculate the composite.
Creating a composite report
Task: Create a composite report
Using the previously created high-grade area you will generate a simple report for the section.
- Choose Composite > Report.
- Enter the information as shown, and click Apply.
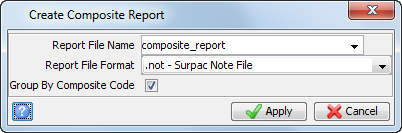
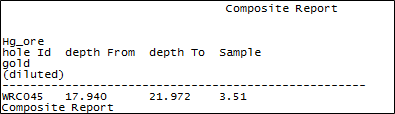
Note: Selecting the Group by Composite code check box groups all the Hg_ore code composites together.