


Column processing
In this section you will take an existing block model and use the functions for column processing in block models to evaluate the economics of the block model.
The data is a block model that contains only one attribute, grade, and a DTM that represents surface topography.
Workflow
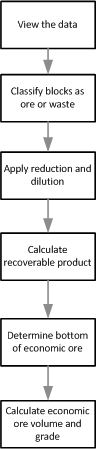
Viewing the data
Task: View the data
- Connect to blockmodel.mdl.
- Choose Block model > Display.
- Enter the information as shown, and click Apply.
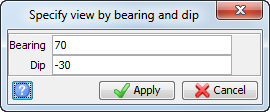
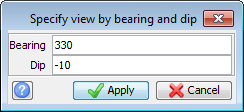
- Choose View > Data view options > View by bearing and dip.
- Enter the information as shown, and click Apply.
- Choose Display > Colour model by attribute.
- Enter the information as shown, click Refresh, and then click Apply.
- Choose Display > New graphical constraint.
- Enter the information as shown, and click Apply.
- Choose View > Data view options > View by bearing and dip.
- Enter the information as shown, and click Apply.
- Choose View > Data view options > View scale factors.
- Enter the information as shown, and click Apply.
- Choose View > Data view options > View by bearing and dip.
- Enter the information as shown, and click Apply.
- Open blocktopo1.dtm.
- Choose View > Data view options > View by bearing and dip.
- Enter the information as shown, and click Apply.
- In the Layers pane, right-click on the layer blocktopo1.dtm, and choose Delete layer.
- Click Zoom all
 .
. - Choose Database > Sections > Define.
- Enter the information as shown on the Section Method tab.
- Enter the information as shown on the Section Block Model tab, and click Apply.
- Click Next section
 to view each of the four sections.
 - Choose Block model > Close
- Click Reset graphics
 .
.
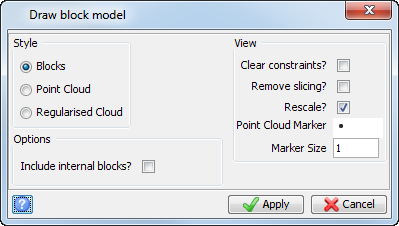
The block model is displayed.
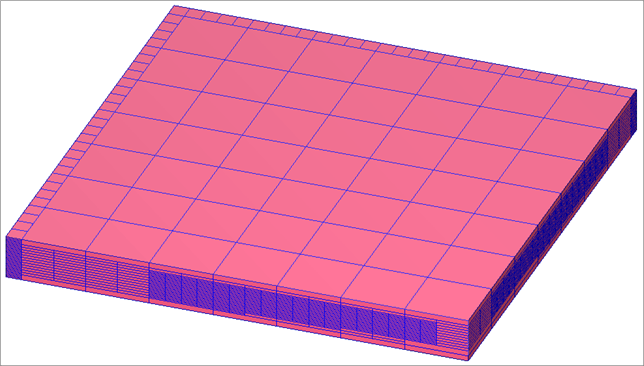
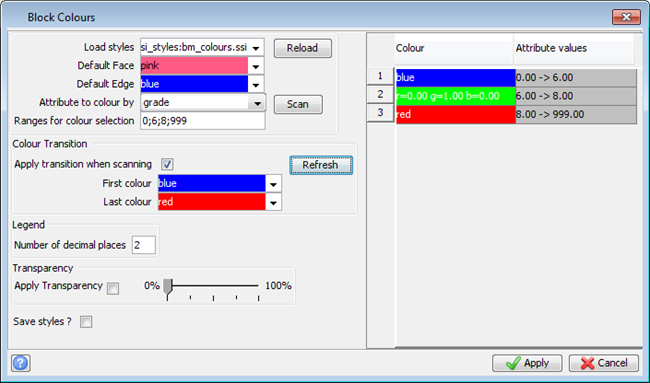
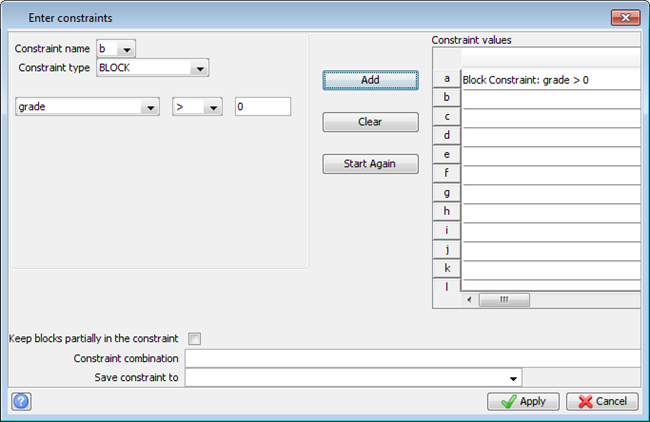
The model is displayed.
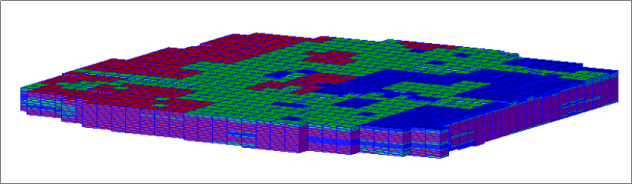
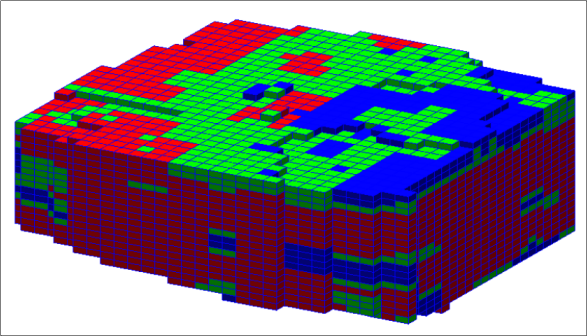
The blocks in this model are 35 metres in the x and y dimensions and 3 metres high. Because the vertical extent of this model is limited compared to the horizontal extent, you will vertically exaggerate this model by a factor of 5.
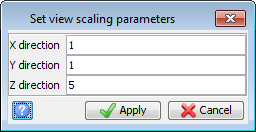
After exaggerating the model five times, to get the view at a bearing of 330 degrees and a dip of -20 degrees, you need to set the View by Bearing and Dip to a dip of -4, that is, the dip you want divided by the vertical exaggeration.
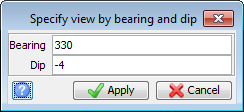
The view of the model is rotated slightly.
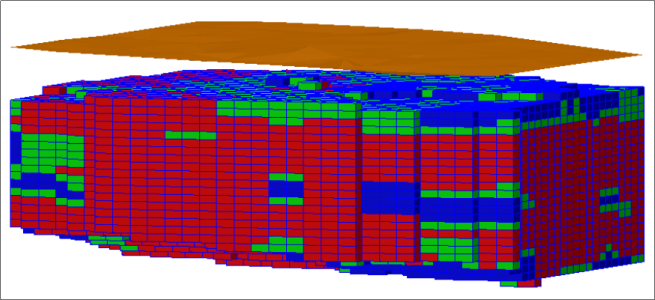
The view of the model was changed to Plan when you opened the DTM, now it is reset.
Notice the separation between the topography and the highest blocks with any grade. This separation is called the overburden.
You will now slice the model to see the internal structure.
This moves the data back to plan view
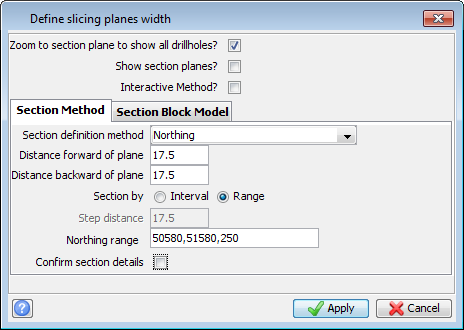
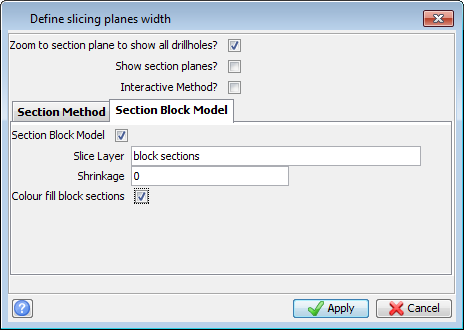
The first section through the block model is displayed.
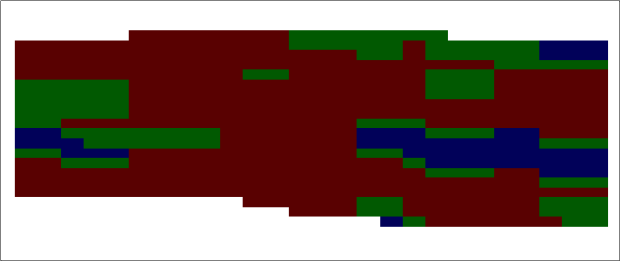
You should now have a good idea of how the block model looks and are ready to start the economic modelling process.
 Note: To see all of the steps performed in this task, run _10_viewing_the_data.tcl. You need to click Apply on any forms presented.