


Create entity legend
You can use this function to create a reusable legend for the entities that commonly appear in your plots. For example, you could use an entity legend to help people distinguish between a fence line and a contour, or to distinguish between a collar, a survey station, a blast hole, and a spot height.
After you have created the legend, which is associated with a title block, when you plot using AUTOPLOT or PROCESS MAP and you choose that title block, the legend (and the rest of the title block) are displayed in the plot.
Prerequisites: In the Plot Sheet Setup window, you have used Title Block > Select to select a title block.
To run this function: In the Plot Sheet Setup window, choose Title blocks > Create > Entity legend, or
Fields on the Legend properties form
| Field | Description |
|---|---|
| X position |
The distance, in the X axis, of the left side of the legend, relative to the lower left corner of the title block. Both X position and Y position are set after you have dragged an area for the legend with the mouse, but you can edit them. |
| Y position | The distance, in the Y axis, of the lower side of the legend, relative to the lower left corner of the title block. |
| X size |
The width of the legend. That is, the width of the invisible box that contains all the legend entries. If X size is greater than Y size, the legend is rotated 90 degrees. |
| Y size | The height of the legend. |
| Priority |
An integer between 0 and 125 that determines which lines will overwrite any text in the legend. When a line and some text would be drawn in the same space, the entity that has the higher priority is drawn. |
| Font Name | The font used for the labels of the legend. |
| Bold | Whether or not to apply bold formatting to the labels of the legend. |
| Italic | Whether or not to apply italic formatting to the labels of the legend. |
| Underline | Whether or not to underline the labels of the legend. |
| Text height | The height of the labels of the legend in centimetres. |
| Define the entities to use in the legend | You can add multiple rows in this section - one row for each entity you want to see in the legend. |
| Entity |
The entity for which you want to see a symbol in the legend. The right arrow button in the Entity field displays the Entity form that shows an example of each entity.
|
| Label | The text to appear beside the entity in the legend. |
| Type |
The type of shape used to create the legend element.
|


Output
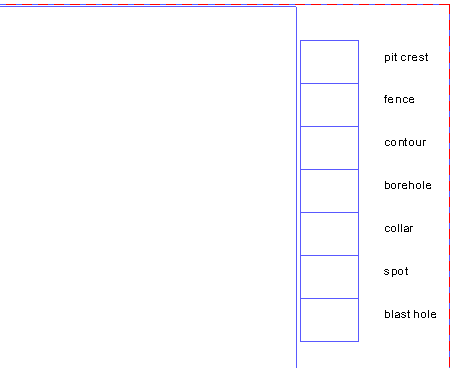
An entity legend is created on the title block showing blank boxes where the entity symbols will be, and showing the labels beside them.
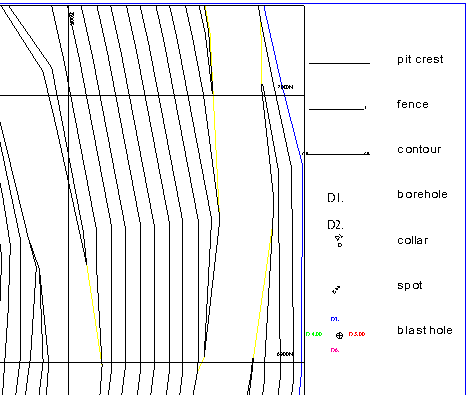
 Note: The entity symbols are displayed when you produce the plot, either using AUTOPLOT or PROCESS MAP.
An example of entity legend in the Plot Sheet Setup window is as follows.
When you use AUTOPLOT to produce a plot, and use the title block that contains the legend, the legend is displayed as follows.
 Troubleshooting