


Report block define
When you run this function, the Graphical Sequencer will prompt you to select a mining block for which the quantities and grades of all materials contained in the selected block, as specified in the format file, will be calculated.
To run this function: Choose Design > Graphical Sequencer > Define Blocks > Report Block, or...
Once all quantities and grades have been calculated for the selected block, the Block Report form is displayed.
As you report on selected blocks, the Graphical Sequencer allows you to accumulate them in a running total. That is, when details of the block are displayed on the Block Report form, you can click Total to display the current value of the totals on the Report Totals form.
Both of the above forms allow you to choose from the following actions which appear on the menu grid of each form except where explicitly indicated:
| Add | Add the currently selected block to the accumulated totals and colour the selected block to indicate it has already been added to the total. The form Report Totals will then be displayed to indicate the value of the current totals. |
| Subtract | Subtract the currently selected block from the accumulated totals, only if the selected block has been previously added. The form Report Totals will then be displayed to indicate the value of the current totals. |
| Clear | Clear the current totals and redisplay the Block Report form. |
| Total | Appears only on the Block Report form and will cause the Report Totals form to be displayed. |
| Block | Appears only on the Report Totals form and will cause the Block Report form to be displayed. |
| Cancel | Finish reporting and return to Define Blocks |
What Happens When You Report a Block
When you choose Report Block to find the contained materials in a mining block, the Graphical Sequencer intersects the orebody with that mining block. The method of intersection then depends on whether the orebody is represented by a string model or a points model.
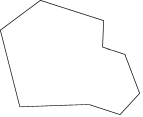
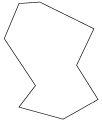
If the orebody is represented by a string model, each of the strings defines the shape of a polygon of ore.
|
|

|
| ore polygon represented by string 1 | ore polygon represented by string 2 | ore polygon represented by string 3 |
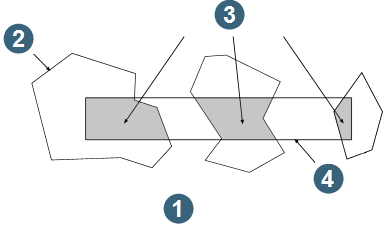
For each mining block you want reported, the Graphical Sequencer calculates an intersection between that mining block and the polygons, and from there calculates the material content of the intersection.
Calculating the intersection is the same process normally performed in Polygon Intersection.
|
|
1. string ore model intersection of mining block with three ore polygons 2. ore polygon 3. intersection composed of three isolations 4. mining block |
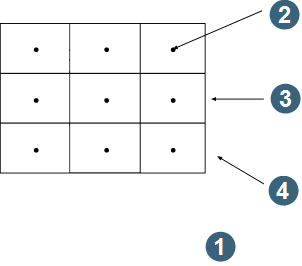
If the orebody is represented by a points model, each point in its string files is the centroid of a rectangular block of ore.
All blocks in the model are the same size - the size elected when you originally created the model, see Define Format - Orebody Model Specification.
|
|
1. point ore model in plan, one string point per centroid 2. centroid 3. ore block 4. ore blocks in regular rectangular pattern |
The Graphical Sequencer regards each ore block as having a uniform grade equal to the value in the centroid's D fields.
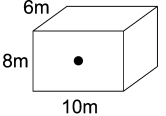
For example, if the ore block size is:
Y = 10 m
X = 8 m
Z = 6 m
and the grade of the centroid is 2% copper say, the Graphical Sequencer regards that block as 480 m3 at 2% copper.
|
volume of ore block = 10 x 8 x 6 = 480 cubic metres |
| point ore model in plan, one string point per centroid |
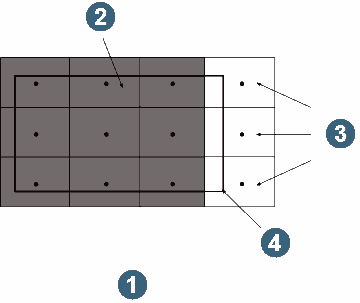
For each mining block you want to report, the Graphical Sequencer calculates a notional intersection between that mining block and the ore blocks - notional meaning that it:
- includes the whole of the ore blocks whose centroids are within the mining block, and
- ignores the whole of the ore blocks whose centroids are outside the mining block
|
|
1. point ore model in plan, notional intersection of mining block with ore blocks 2. intersection is composed of six whole ore blocks whose centroids are inside the mining block 3. The Graphical Sequencer ignores these three blocks because their centroids are outside the mining block 4. mining block |
The Graphical Sequencer then calculates the material content of the notional intersection.
You will notice that mining block reports from points ore models use approximations. Their accuracy can vary with the size of the ore blocks - the more ore blocks per mining block, the more accurate the results. In normal practice the difference is too small for concern. But it is well to know that exaggerated conditions can lead to skewed results. In particular, they can happen when a mining block is narrow, or the centroids are widely spaced.
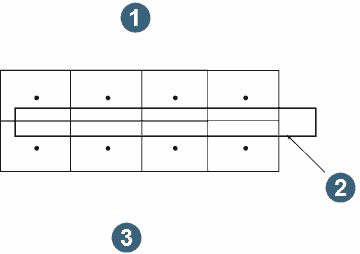
For example, in this points model the mining block is so narrow that it fails to intersect even one centroid. The result is that the Graphical Sequencer reports the mining block as containing only waste, irrespective of how rich the intersected blocks might be.
|
|
1. The Graphical Sequencer ignores all eight ore blocks because their centroids are outside the mining block 2. mining block 3. point ore model in plan, narrow mining block misses centroids |
If you decide to use a points model, you improve the accuracy by ensuring that the ore blocks are the same size or smaller than the mining blocks.