


Example: Create multiple section plots
- Drag and drop section_7320_north.swa to display the data in section view.
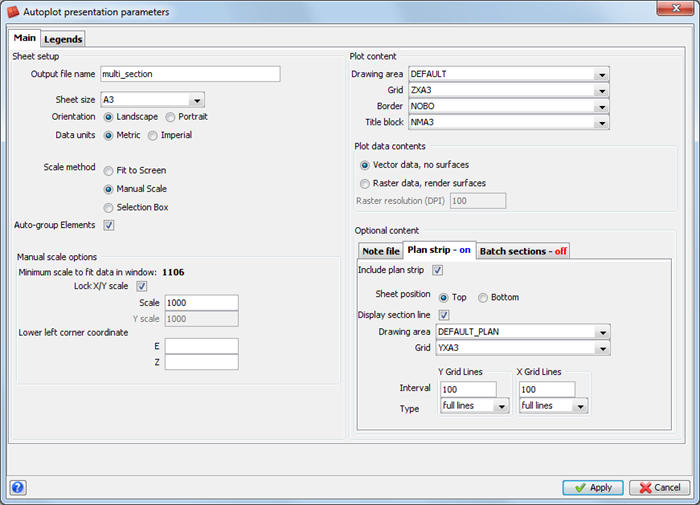
- Click the Autoplot icon
 .
. - Enter the information as shown.
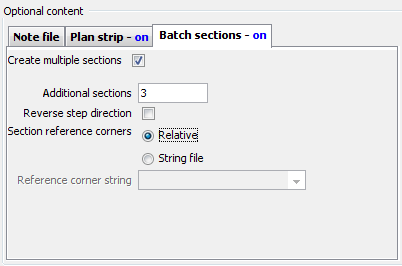
- Click the Batch sections tab.
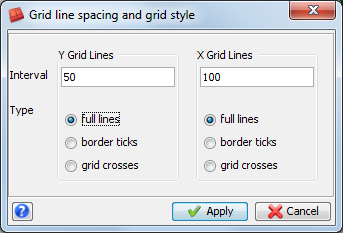
- Enter the information as shown, and click Apply.
- Enter the information as shown, and click Apply.
- Press F1.
- Click and drag to move the box as displayed.
- Press F2.
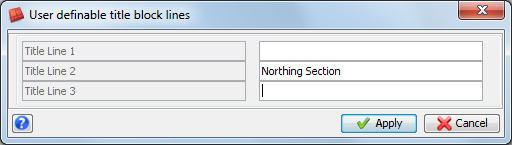
- Enter the information as shown, and click Apply.
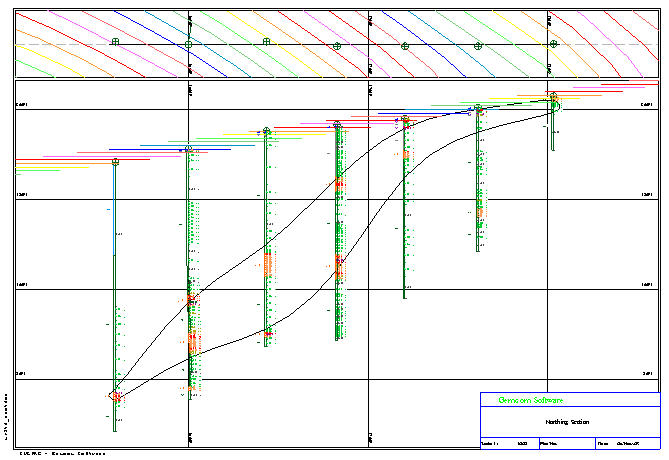
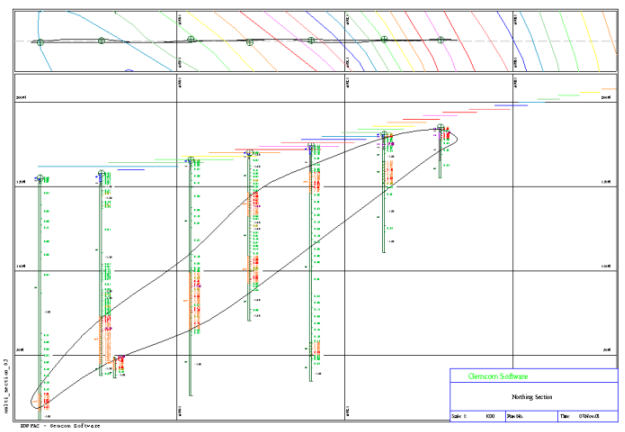
- Drag and drop multi_section.dwf to display the plot.
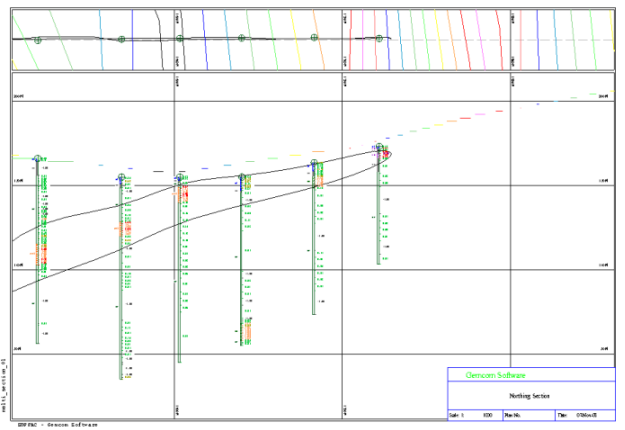
- Drag and drop multi_section_01.dwf to display the plot.
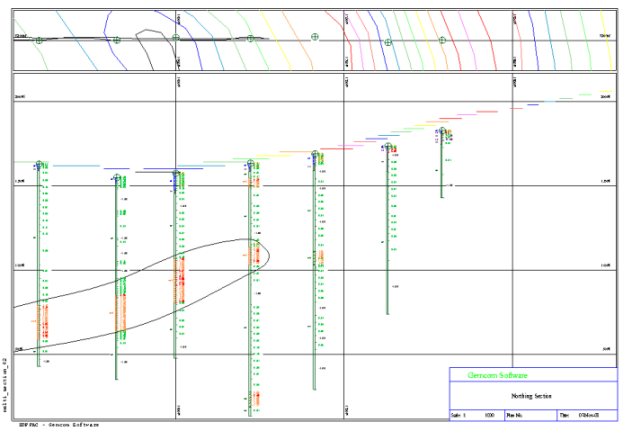
- Drag and drop multi_section_02.dwf to display the plot.
- Drag and drop multi_section_03.dwf to display the plot.
- Choose File > Close to close the Plot Preview window.
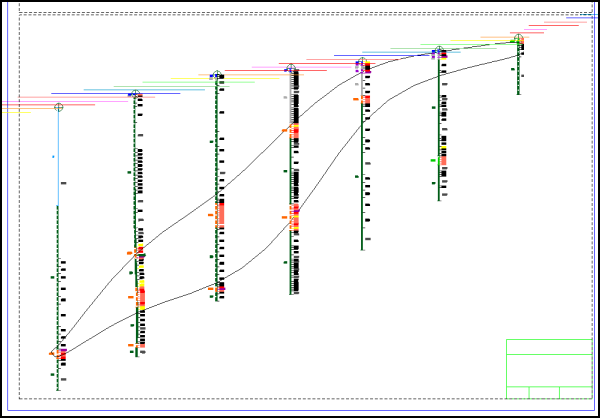
The following files are created.
|
Northing |
Filename |
|
7320 |
multi_section.dwf |
|
7360 |
multi_section_01.dwf |
|
7400 |
multi_section_02.dwf |
|
7440 |
multi_section_03.dwf |
 Note: To see all of the steps performed in this section, run _01d_autoplot_multiple_sections.tcl. You will need to click
Apply on any forms presented.
Note: To see all of the steps performed in this section, run _01d_autoplot_multiple_sections.tcl. You will need to click
Apply on any forms presented.