


Display drillholes
You can use this command to draw the graphical representations of the drillhole traces in Graphics.
To run this function: Choose Database > Display > Drillholes, or Database > Sections > Drillholes, or Design > Blast design > Display > Display loaded blastholes, or Design > Blast design > Sections > Display blast holesor...
 Note: When you draw geology patterns, labels, graphs or apparent dip indicators before defining a section, the data must be loaded from the database for all drillholes (inside the defined constraint). For larger databases, this can cause a significant delay before displaying data.
 Tip: If you only require the data to be drawn one section at a time, it is much more efficient (in terms of memory and speed) to draw any geology patterns, labels, graphs or apparent dip indicators after defining the section. The data for each drillhole is loaded the first time the drillhole is displayed, so each use of VIEWING PLANES BACKWARD or VIEWING PLANES FORWARD loads the data for the newly displayed drillholes.
This will incrementally build an in-memory copy of the database data which you can refresh by running REFRESH DRILLHOLES.
Tip: If you only require the data to be drawn one section at a time, it is much more efficient (in terms of memory and speed) to draw any geology patterns, labels, graphs or apparent dip indicators after defining the section. The data for each drillhole is loaded the first time the drillhole is displayed, so each use of VIEWING PLANES BACKWARD or VIEWING PLANES FORWARD loads the data for the newly displayed drillholes.
This will incrementally build an in-memory copy of the database data which you can refresh by running REFRESH DRILLHOLES.
Fields on the Draw Holes form
| Field | Description |
|---|---|
|
Rescale view to show all holes in plan view? |
|
| Add constraint to holes? |
|
There are seven tabs on this form that allow you to change the appearance of drillholes displayed on screen. These are:
Trace styles tab
You can use the options on this tab to set the trace colour, trace line weight and tick line weight (for tick marks used as depth markers and between interval labels).
| Field | Description |
|---|---|
| Table | To colour the trace based on styles defined for values in a specific table and field, select the table of interest. |
| Field | To colour the trace based on styles defined for values in a specific table and field, select the field of interest. The colours defined for the values of this field using the Drillhole styles editor will be used to colour the trace. |
| Default trace colour | If no style table and field have been selected, the traces will be displayed in this colour. Also, intervals of holes with values for which no style is defined will be displayed in this colour. |
| Default trace thickness | If no style table and field have been selected, the traces will be displayed with this line weight. Also, intervals of holes with values for which no style is defined will be displayed with this line weight. |
| Tick line weight | The line weight used for tick marks (for depth markers and between labels). |
| Cylinder style |
The type of 3D cylinder to display. Options are:
|
| Radius | The cylinder radius. For variable fixed width cylinders. |
| Length/Unit | The radius of the cylinder per sample value unit. For variable width cylinders. |
| Maximum | The maximum radius of a cylinder. For variable width cylinders. Sample values greater than this value will display at the maximum value. This is useful if you have a number of extremely high sample values. |
Collar styles tab
You can use the options on this tab to specify the collar marker type and size, whether to display a collar marker and also to specify a number of collar fields to display.
| Field | Description |
|---|---|
| Display collar markers |
|
| Collar marker | The collar location can be displayed as a variety of hollow or solid triangles, squares, or circles represented by printed characters, such as (.) for a circle with a dot in the centre. |
| Collar marker size | The collar marker size is expressed in units, where one unit is equal to approximately 3% of the screen height. |
| Label orientation |
The collar labels can be drawn centered and stacked above the hole collar, or oriented so that the text runs parallel to the hole path. |
| Label offset | The vertical distance from the collar to the label position. If you enter a positive value the label is displayed above the collar. If you enter a negative number the label is displayed below the collar. |
| Field | The collar field you wish to display. |
| Decimals | The number of decimal places to display for numeric fields. |
| Font | The font style to use for this collar label. |
| Size | Text sizes may be defined using a number of different methods. Each of the methods involves the use of a size and a units specifier eg. 0.03 sru. |
| Units |
The unit type:
|
| Position |
Each field that is drawn can have its position defined explicitly as:
|
Geology patterns tab
You can use the options on this tab to select interval table fields to display as drillhole geology patterns (pattern or colour filled boxes) as shown:
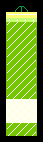
| Field | Description |
|---|---|
| Table | The interval table containing the field of interest. |
| Field | The field for which patterns have been defined. |
| Position | The side of the hole trace on which to display the geology pattern box. The box can be displayed to the right or left of the trace, or centred. |
| Offset | The offset of the pattern filled boxes from the trace (for boxes displayed to the left or right of the hole trace). |
| Width | The width of the pattern filled boxes. |
Labels tab
You can use the options on this tab to select interval table fields to display as drillhole labels. Contiguous identical field values are combined into one interval before display.
| Field | Description |
|---|---|
| Tick length | The length of tick marks used between interval labels. |
| Table | The interval table containing the field of interest. |
| Field | The field to display. |
| Position | The side of the hole trace that the labels are displayed. |
| Alignment | The alignment of the labels. Text can be left or right aligned or centred. |
| Offset | The offset of the label from the trace. |
| Decimals | The number of decimal places to display for the label. |
| Use styles |
|
| Colour | This colour is used if the Use styles check box is left cleared. |
| Font | The font style to use for this label. |
| Size | Text sizes may be defined using a number of different methods. Each of the methods involves the use of a size and a units specifier eg. 0.03 sru. |
| Units |
The unit type:
|
| Minimum value | The minimum label value displayed. The label value must be greater than or equal to this value to appear in Graphics. |
| Maximum value | The maximum label value displayed. The label value must be less than or equal to this value to appear in Graphics. |
Graphs tab
You can use the options on this tab to select interval table fields to display as drillhole graphs.
| Field | Description |
|---|---|
| Table | The interval table containing the field of interest. |
| Field | The field to graph. |
| Position | The side of the hole trace on which to display the graph. |
| Offset | The offset of the graph from the trace. |
| Graph type |
The type of graph to draw:
|
| Use styles |
|
| Colour | The colour to use for this graph. |
| Length/Unit | This input enables you to control the size of the graphs by entering the length of the graph per sample value unit. For example, if your drillholes are 20 metres apart on the section and you are plotting a graph of gold assays measured in g/t, where all of the assays values are less than 10 g/t, you could enter either 1 or 2 here to prevent the graphs overplotting the next drillhole trace. |
| Maximum | You can limit the maximum size of the graph, ie. the maximum offset of the graph from the drillhole trace. Any sample values exceeding this value will be graphed at the maximum value. This is useful if you have a number of extremely high sample values. |
Depth markers tab
You can use the options on this tab to specify the attributes of drillhole depth markers displayed for each hole.
| Field | Description |
|---|---|
| Display depth markers |
|
| Major tick distance | The distance between each major (labelled) tick. |
| Major tick length | The length of each major (labelled) tick. |
| Minor tick distance | The distance between each minor (unlabelled) tick. |
| Minor tick length | The length of each minor (unlabelled) tick. |
| Position | The side of the hole trace on which to display the depth markers. |
| Alignment | The alignment of the major tick labels. |
| Offset | The offset of the major tick labels, as a distance from the hole trace. |
| Decimals | The number of decimal places to display for the major tick labels. |
| Use Styles |
|
| Colour | The colour to use for display of depth markers. |
| Font | The font style to use for the depth markers. |
| Size | Text sizes may be defined using a number of different methods. Each of the methods involves the use of a size and a units specifier eg. 0.03 sru. |
| Units |
The unit type:
|
Apparent dip indicators tab
You can use the options on this tab to select point table azimuth and fields to display as apparent dip indicators.
| Field | Description |
|---|---|
| Table | The point table containing the structural fields of interest. |
| Azimuth Field | The field containing azimuth data. |
| Dip Field | The field containing dip data. |
| Position | The side of the hole trace on which to display the apparent dip indicators. |
| Offset | The offset of the centre of the indicators from the trace. |
| Length | The length of the apparent dip indicators. |
Output
The holes are displayed in Graphics with the new drawing styles applied. If you selected Add constraint to holes?, the Define Query Constraints form is displayed so you can constrain the holes.
Messages
| Message | Description |
|---|---|
Cannot connect database xxx.mdb. |
Could not find file xxx.mdb. |
Cannot connect database xxx.ddb. |
The message appears if something has happened to the database connection. Either one of them has been renamed, or corrupted, or the database is no longer in the folder that the ddb has specified. |