


The variogram map window
The controls required to interact with the variogram map are presented at the top of the variogram map window.
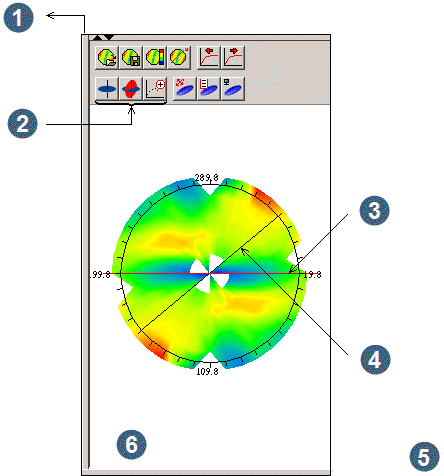
- Drag the divider to increase the size of the variogram map
- The content of the variogram map window is indicated by the toggle buttons
- The red line indicates the direction of maximum continuity in this plane
- The black line indicates the orientation of the currently displayed experimental variogram
- The orientation of the plane of the variogram map is displayed below the map
- Plane dips - 27.09 towards 289.8