Variogram Validation
You can use this function to validate the variogram curve produced using Variogram Modelling.
For each data point, a kriged grade can be calculated and compared with the measured grade.
To run this function: Choose Block model > Geostatistics > Variogram validation, or...
- In the Function Chooser, type VARIOGRAM VALIDATION, and press ENTER.
In order to be considered appropriate the following conditions should be satisfied:
- The average error should be close to zero.
- The variance of the errors should be close to the average predicted kriging variation.
- The histogram of errors looks normally distributed and approximately 95% of the errors are within +- 2 x krigvar.
The variogram in this function is described in the same way as it will be in the actual kriging.
Procedure
- Choose Variogram > Validation.
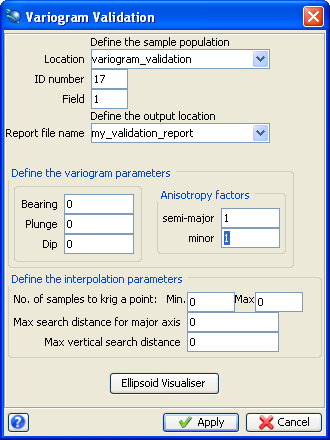
| Form Feature |
Description |
| Define the sample population |
The sample data which is to be validated must be identified by entering the Location and ID number of the string file and the description Field number which contains the sample values.
|
| Define the output location |
This is used to identify the note file which will contain the results of the validation.
A note file having this location, the ID number of the sample file and a file extension of '.not' is created to contain the results.
|
| Define the variogram parameters |
|
|
Bearing of major axis, Dip of major axis, Tilt about major axis.
|
Bearing and dip conventions were explained previously in Variogram Calculation.
These three angles define the direction of the major axis of the search ellipsoid.
For an isotropic search ellipsoid, these values will all be zero, since there is no identified direction for the major axis.
The angle for the tilt can be determined by imagining you are standing at the origin or centre of the search ellipsoid and looking along the major axis.
If the ellipsoid tilts in a clockwise direction the tilt angle is negative; if it tilts in an anticlockwise direction the tilt angle is positive.
Angles are specified on the positive axis as shown on the diagram below.
|
| Anisotropy factors semi-major and minor |
Anisotropy factors are the ratios of the length of the major axis to the lengths of the semi-major and minor axis.
The anisotropy factors can be calculated as follows:
semi-major = maximum range in direction of major axis/maximum range in direction of semi-major axis
minor = maximum range in direction of major axis / maximum range in direction of minor axis
For an isotropic search ellipsoid these ratios would be equal to 1.
They cannot be less than 1 as the length of the major axis is always greater than the other axes if there is anisotropy.
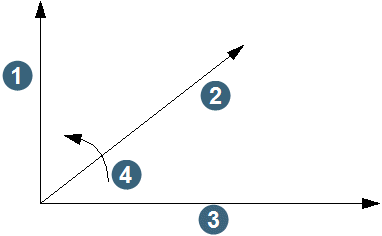
1. minor axis
2. major axis
3. semi-major axis
4. positive tilt direction
|
| Define the interpolation parameters |
These parameters define the search parameters to determine which sample points are used in the calculations. |
|
No of samples to krig a point
Minimum, Maximum
|
The number of samples used to calculate the kriged value for each point can be restricted by entering a minimum number and a maximum number.
The minimum number of samples to use depends on the number of samples available and the sampling density.
Usually at least two samples should be used and if the sampling density is high then at least five samples should be used.
The maximum number of samples to use affects the time taken to carry out the kriging calculations in a non-linear fashion, so that twice the number of samples quadruples the processing time.
Since the process of kriging forces samples close to the point being estimated to screen out samples further away (by assigning very small or negative weights to samples far away), the maximum number of samples to use should be restricted to about 15-20 so that processing time is minimised. |
| Maximum search distance for major axis |
The maximum search distance is used in conjunction with the maximum number of samples to select samples to be used in the kriging calculations.
It should generally (although not necessarily) be set to a value slightly greater than the range of the variogram of the major axis.
The exception to this would be where it has been established that the Kriging Weights based on a typical block / sample configuration tend to zero at a distance shorter than this range.
While the range of the variogram gives the maximum distance at which there is some correlation between data points, it is the magnitude of the kriging weights that ultimately determine the distance to which significant samples will be found.
The maximum search radius is measured in the direction of the major axis.
The search distances for the semi-major and minor axes are influenced by the anisotropy ratios which are used to define the shape of the ellipsoid.
Only if these ratios are both equal to 1.0 will the maximum search distance be equal in all directions. |
| Maximum vertical search distance |
This distance is used to exclude samples that are greater than the maximum vertical search distance from the kriging calculations.
If 2-dimensional kriging is required, then this distance should be set to a value less than the vertical length of the samples used.
If 3-dimensional kriging is required, then the vertical distance can be set to quite a large value.
In orebodies that show definite layers, such as coal deposits or lateritic deposits, the vertical search would normally be set to the thickness of the deposit.
 Note: This is a VERTICAL search distance and is not influenced by the orientation of the search ellipsoid.
To be used in estimating a value for a block, a point must first fall within the search ellipsoid and it must also be within the maximum vertical search distance. Note: This is a VERTICAL search distance and is not influenced by the orientation of the search ellipsoid.
To be used in estimating a value for a block, a point must first fall within the search ellipsoid and it must also be within the maximum vertical search distance.
|
- Fill in the fields on the Variogram Validation form.
- Click Apply.
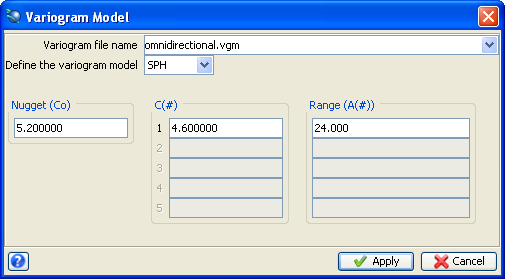
| Form Feature |
Description |
| Variogram file name |
The name of the (.vgm) variogram file. |
| Define the variogram model |
The type of model and the model parameters will have been determined using Variogram Modelling.
One of the three variogram model types can be specified here.
The variogram model parameters need to be provided.
Enter the model type which is to be used for the kriging.
The values which may be entered are: SPH (Spherical), NSP (Nested Spherical), or EXP (Exponential). |
| Number of structures |
For NSP type model values from 2 to 5 may be entered.
|
| |
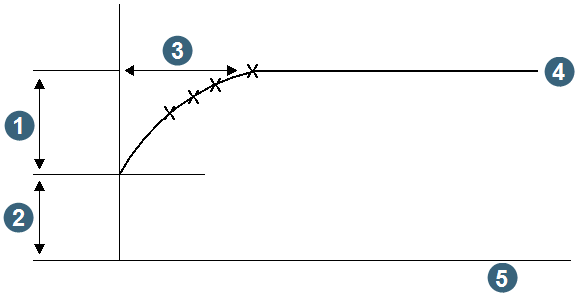
1. C
2. nugget Co
3. range a
4. sill
5. distance h
|
| Nugget (Co) |
Enter the nugget effect value here.
This should be the same for all three directions of the ellipsoid.
If the ranges of the three ellipsoid directions were determined using logarithmic variograms, the nugget effect and C values must be obtained from variograms calculated from the raw data.
Often an omni-directional variogram of the untransformed data gives the best results. An example value is 5.2. |
| C |
Enter the C value here. An example value is 4.6. |
| Range (A(#)) |
The range of the variogram in the major direction of the ellipsoid is entered here. An example value is 24. |
- Fill in the fields on the Variogram Model form.
- Click Apply.
Output
The outputs from the variogram validation are a string file, a .not file, and a scatter plot in the Basic Statistics window.
String file
The string file is a copy of the string file you entered in the Define the Sample Population Location field, except that each point that is estimated in the string file contains the following D fields.
| D field |
Field name |
Description |
| D1 |
grade |
The sample value that you are validating. This value is the same as the value that is stored in the D field, in the input string file, that contains the samples. Typically this is the grade value.
|
| D2 |
kriged grade |
The kriged grade. |
| D3 |
error cl |
The error calculation which is calculated as error cl = kriged grade - grade. |
| D4 |
dif |
The difference between error calculation and square root of kriging variance. dif = error cl - sqr var |
| D5 |
sqr var |
The square root of the kriging variance.
Note: Kriging variance = sum of (weighted point to block variance) - (variance within the block) + LaGrange multiplier.
|
Note: If a sample is not estimated, such as if there are insufficient samples in the search ellipsoid, the point in the output string file remains unchanged compared to the input string file.
.not file
The .not is the Location specified on the Variogram Validation form, and the ID number of the string file that was used as input to the program.
The .not file summarises the validity of the variogram used. It reports on only the samples that were estimated. An example is as follows.
| SUMMARY STATISTICS OF KRIGING ERRORS |
|
|
| |
|
|
| MEAN |
.0006 |
|
| VARIANCE |
3.3027 |
<<<<< |
| SSTD DEVIATION |
1.8173 |
|
| AVE. SQ. ERROR |
3.3002 |
|
| WEIGHTED SQ. ERR |
3.3603 |
|
| SKEWNESS |
-1.4860 |
|
| KURTOSIS |
12.2145 |
|
| NO. OF ASSAYS |
1336 |
|
| AVE. KRIGE VARIANCE |
3.4459 |
<<<<< |
| TWO STD. DEVIATIONS |
95.74 |
<<<<< |
There are several key points to look for in this output.
The summary statistics of the kriging errors give the variance of the actual kriging errors along with the theoretical kriging variance.
If the variogram model is a good model for the data set used, then these two values will be within 15% of each other.
The mean of the actual kriging errors is also given and should be very close to zero.
Finally, the percentage of the kriging errors within two standard deviations of the mean should be about 95%, indicating that the spread of kriging errors is not very large.
The above output meets all of these criteria, so the variogram model used is appropriate for the data set used.
The histograms of kriging errors, and kriging errors divided by the square root of the kriging variance should both show a normal distribution, with a mean around zero.
Scatterplot
The scatterplot of the estimate minus the true grade versus the estimated grade will show the spread of errors in estimation, and will also indicate if there is any tendency to over-estimation by using the specified model.
Ideally, this plot should show a cloud of points around the zero line running across from the vertical axis.



 Variogram Validation form.