Variogram Report
Overview
You can use this function to create a report listing the nugget as well as the sills and ranges
for each structure of the current variogram model. Parameters for the
current variogram model may also be set by supplying appropriate values
in the form fields, including the addition and deletion of structures.
Any changes will be reflected in the graphical plot.
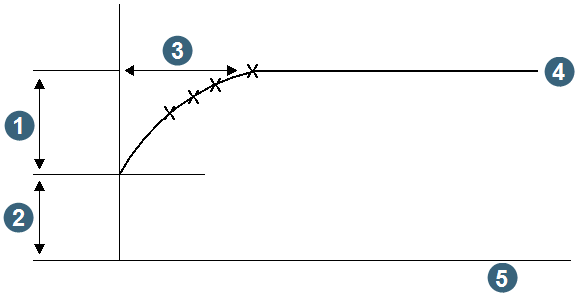
1. C
2. nugget Co
3. range a
4. sill
5. distance h
Procedure
- Choose Variogram > Report or click the
 icon from the Variogram model window.
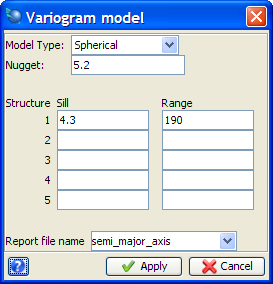
| Form Feature |
Description |
| Model Type: |
The current variogram model type (Spherical,
Exponential, Gaussian, or Hole Effect) is displayed.
You can change the model to a different type. |
| Nugget (Co) |
The current value of the nugget is displayed.
You
can change the value of the nugget by entering a
different value.
The nugget effect is the value of gamma(h) at zero distance on the variogram.
The nugget effect represents the inherent variability of the data. This
could be due to both the spatial distribution of the values, and any errors
in determining those values, such as errors in sampling. The value of
the nugget effect should be close to zero in deposits that have a very
uniform grade distribution, such as porphyry coppers. In most gold deposits
however, the nugget effect tends to be quite large due to the `nuggety'
nature of the mineralisation, as samples taken close together potentially
have very different grades.
A good estimate of the nugget effect is important. However, in most
deposits, the sampling density is such that short-range variability, including
the nugget effect, is difficult to estimate. However the nugget is the
same in all directions. This means the nugget effect can be determined
using a downhole variogram with a direction of the average azimuth and
dip of the drill holes and lag distance equal to the downhole sample spacing. |
|
Sill (C)
|
The current value of the sill for each structure
is displayed.
You can change the value of the
sill by entering a different value.
The difference between the gamma(h) value at which the variogram curve
levels off (the sill) and the nugget effect, is called the C value.
The sill represents where the variogram function becomes a random function
independent of distance. This value is related to the theoretical variance
of the data set, which is usually used as a guide when modelling the variogram. An example value is 4.3.
|
| Range (A) |
The current value of the range for each structure
is displayed.
You can change the value of the
range by entering a different value.
The distance at which the variogram reaches the sill is called the range
of the variogram. Beyond this distance there is no longer any correlation
between samples, which have become statistically independent. An example value is 190. |
|
Report file name
|
Specify the name of a file to save the model parameters, or leave the field
blank if a file is not required.
A *.NOT file will be created with the name given here. For example, semi_major_axis.not. |
- Fill in the fields on the Variogram Model form.
- Click Apply.
The specified *.NOT file is created.
If any variogram parameters were changed on the form, the variogram is redisplayed using the values entered.



 Variogram
Model form .
Variogram
Model form .