


Variogram Model
Overview
 Note:This function only applies when viewing Normal variograms.
An initial model of the currently selected type (Spherical, Exponential, Gaussian, or Hole Effect) will be drawn with a nugget effect and single structure. This model has been fitted using a heuristic to minimize the function:
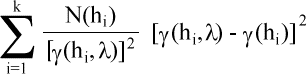
where k is the number of points on the experimental variogram,
 is the value of the experimental variogram for lag h,
 is the value of the variogram model for lag h and
  is the number of pairs of points for lag h.
This is sometimes known as "Cressie" weighting after Cressie, N. Fitting variogram models by weighted least squares. Journal of the International Association for Mathematical Geology, 17, 563-586.
This automatic fitting is not supplied to replace manual fitting but provides an initial single structure model with an objective mathematical "good fit".
Procedure
- Choose Variogram > Model or click the
 icon from the Variogram model window.
 - The markers may be selected and dragged to new locations and the model variogram will be updated to reflect any changes.
The markers will be active until Variogram > Delete model or File > Close is chosen.
Poor looking variograms?
Some of the common reasons for a poor looking variogram are:
- Not enough samples. Unfortunately calculating a variogram needs a lot of samples. Any calculation using less than 100 samples may give poor results.
- Heterogeneous data. Maybe the area being studied is not homogeneous and therefore does not have a constant variance. The data may need to be split into different sets based on geology, mineralogy, or structure. For example, samples from a supergene enriched zone would need to be studied separately from the primary zone mineralisation.
- Variogram parameters are wrong. Sometimes the variogram is quite sensitive to the choice of class size, lag distance, and window tolerance. A good starting point for the class size is the average spacing between the samples.
- Sample data bad. Any errors made during sampling and assaying add a random component of variance to the variogram and increase the nugget effect. If the data are bad, the variogram may show a total nugget effect.
- Data needs trimming. The estimator of the variance is very sensitive to outliers. A chaotic looking variogram can often be improved by limiting the maximum grade value used in the calculation.
- Sample support size not constant. The data values must all have the same support length. If variable length drill hole samples have been used, use Composite Downhole or Composite by Elevation to create samples of uniform length. Be careful when selecting the composite size as this can affect the variogram. The larger the composite size, the lower the sample variability which will ultimately result in a higher tonnage and lower grade estimation.
- Mixing of data sets. If a number of drill hole sizes, sampling methods or assaying methods were used, each data set should be statistically analysed separately to see if there are any significant differences.