


New Database Variogram
Overview
Function: VG DATA SELECTION
You can use this function to create a variogram directly from a drillhole database.
This function composites the selected drillholes as described in Composite Downhole. If the parameters are the same in both functions, the generated composites are exactly the same as when Composite Downhole is chosen.
Procedure
- Choose File > New > Database variogram.
Choose Variogram > New database variogram.
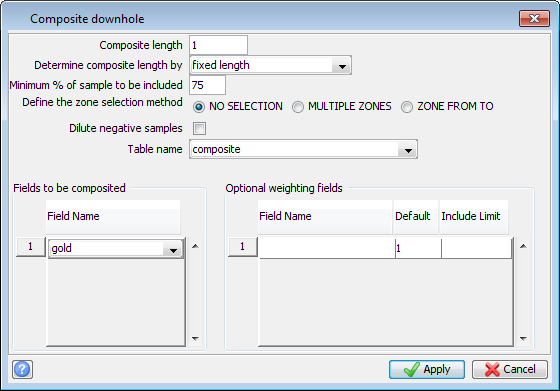
 Composite Downhole form.
| Form Feature | Description |
|---|---|
| Composite length | Enter the length of the composites that you wish to generate. |
| Determine composite length by | The composite length can be determined by either fixed length or best fit. |
| Minimum % of sample to be included | Enter the minimum percentage of the composite length for which samples must be present. Any composites with less than this amount of sample data available will be written to the nominated string+1 (e.g. if nominated string is 1, composites with less than this amount will be written to string 2). For example, if the composite length is 2 m and the minimum percentage of the sample to be included is 75%, then there must be at least 1.5 m of sample data in the interval to form a composite. These short composites will occur at the end of a hole or immediately before a gap in sampling. |
| Define the zone selection method |
You can restrict the bulking of grades to be within particular geological zones by choosing one of the following:
NO SELECTION, do not select by geology.
|
| Dilute negative samples | Select the check box to cause negative samples to be treated as zero. Clear the checkbox to cause negative samples to be ignored, in which case the composited grade will be calculated over the non-negative assays in the composite. |
| Table name | Enter the name of the table containing the sample data to be used for defining the sample fields which are to be extracted. An example value is composite. |
| Fields to be composited, Field name | Enter the name of each of the sample fields which are to be included in the string file containing the composite samples. |
| Optional weighting fields - Field Name, Default |
If required, the calculation of the grades/qualities in the composite samples may be weighted by some other field/s in the sample table in addition to the length weighting which is already performed.
Under some circumstances it is likely that no values may be available for the weighting field for some samples. The Default input field permits a reasonable default value to be defined to cover this circumstance.
|
| Include Limit | Just as rejection criteria based on length can be defined, when using the optional weighting criteria, additional optional rejection criteria can be defined for each of the weighting fields which are being used. The composite samples which are rejected are saved to the defined string number + 1 and are known as Short samples.
A Short sample may be determined by length criteria alone or may use 0 or more of the optional weighting values to determine if a sample is Short or not. Enter an appropriate value for each weighting field to determine if a composite sample provides sufficient support for subsequent geostatistical evaluation. If a weighting field of recovery (%) is used, an appropriate cutoff value might be 90%. This is then used with the Minimum % of sample length to determine if a composite sample is Short or not. |
- Fill in the fields on the Composite Downhole form.
- Click Apply.
Define Query Constraints form.
| Form Feature | Description |
|---|---|
| Field Name | Enter the name of the field upon which you wish to impose field constraints. |
| Operand | Enter the operation that will define the field constraints. Valid entries for the operand are: < less than, <= less than or equal to, > greater than, >= greater than or equal to, <> not equal to, = equal to. |
| Constraint Value | Enter the value of the constraint that you wish to apply to the named field. When entering a character constraint value, e.g. station_id, it is important to enter the name exactly as entered earlier when setting up the database. |
- Fill in the fields on the Define Query Constraints form.
- Click Apply.
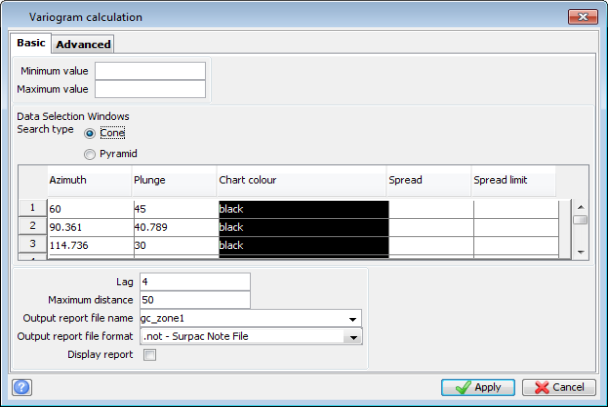
Basic tab of the Variogram Calculation form.
| Form Feature | Description |
|---|---|
| Minimum value | Specify the sample population by providing the Location, Id range and String range of the string file(s) data. If the String range is left blank, all strings in the specified files will be used. |
| Maximum value | Provide the description field containing the data. You may also enter minimum and/or maximum values by which to constrain the sample selection. If no minimum and/or maximum value are specified, then no constraints will be applied. |
| Data Selection Windows | You can calculate a variogram in any direction. The variogram is a search cone (or pyramid) around a central search line. |
| Search type |
1. spread.
|
| Azimuth | The azimuth is the direction of the search line in a horizontal plane. The value entered is a decimal angle in the range 0 to 360 degrees. The reference direction NORTH assumes an azimuth of 0 degrees. |
| Plunge | The plunge is the angle made by the search line with the horizontal in the direction of the azimuth and is entered as a decimal angle in the range -90 degrees(vertically down) to 90 degrees(vertically up). |
| Spread | This field is available only when Search Type is Cone. For each window you are asked to specify a search spread (angular tolerance) which is the angle (in decimal degrees) between the search line and the edge of the window (search cone). For example, a spread of 2 degrees and an azimuth of 90 degrees will result in a search between 88 degrees and 92 degrees. The spread must be in the range 0 (strictly linear) to 90 (omni-directional). |
| Spread limit | This field is available only when Search Type is Cone. The lateral extent of the search may be restricted by a spread limit which is the maximum distance the search may extend from the search line. In effect, the search cone degenerates to a search cylinder with a radius equal to the spread limit. No limit is applied if this field is left blank. |
| Horizontal spread |
This field is available only when Search Type is Pyramid. Horizontal spread is the horizontal angle (in decimal degrees) between the search line and the edge of the search pyramid. The following diagram shows the Horizontal spread where the Plunge is 0.
|
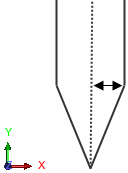
| Horizontal spread limit |
This field is available only when Search Type is Pyramid. The distance away from the search line, in the horizontal direction, at which the search pyramid becomes a rectangular prism. The following diagram shows the Horizontal spread limit where the Plunge is 0.
|
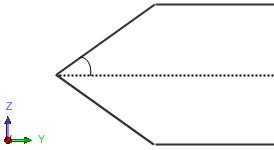
| Vertical spread |
This field is available only when Search Type is Pyramid. Vertical spread is the vertical angle (in decimal degrees) between the search line and the edge of the search pyramid. The following diagram shows the Vertical spread where the Plunge is 0.
|
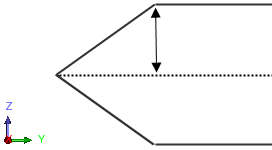
| Vertical spread limit |
This field is available only when Search Type is Pyramid. The distance away from the search line, in the vertical direction, at which the search pyramid becomes a rectangular prism. The following diagram shows the Vertical spread limit where the Plunge is 0.
|
| Chart Colour | Brings up a colour chooser to determine the colour of the chart. |
| Lag, Maximum distance | The gamma(h) function is calculated for h given by integral multiples of the specified lag up to a given maximum distance (Max Dist). A lag tolerance of half the lag distance is used. This means if a lag of 2 is used the tolerance is 1 to 3. 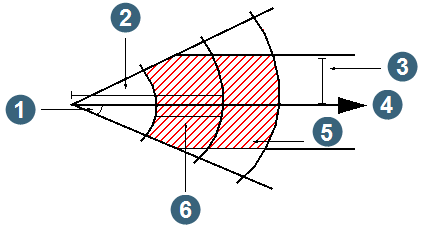 1. spread |
| Output report file name, Output report file format | Provide the name and format of the file to which to write information regarding the variogram calculations. If the file name is not specified then no file will be written. |
| Display report | Select this check box if you want the report to be displayed after creation or clear it to just create the report file. |
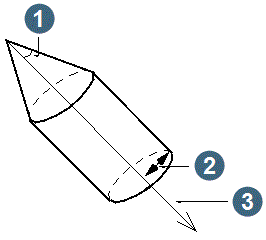
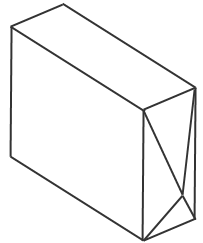
 Tip: To create a solid and a string file that show the search cone or pyramid, add the following to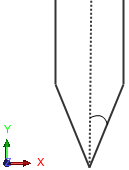
- Fill in the fields on the Basic tab of the Variogram Calculation form.
- Click the Advanced tab.
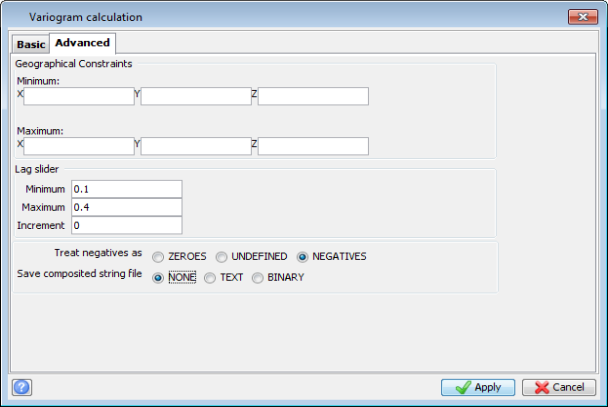
Advanced tab of the Variogram Calculation form.
| Form Feature | Description |
|---|---|
| Minimum XYZ, Maximum XYZ | The data may be constrained geographically by specifying minimum and/or maximum X, Y and/or Z coordinates. Samples are constrained only by those fields specified. For example, entering a minimum Y coordinate of 10000 and leaving the rest of the fields blank will result in all samples whose Y coordinate is greater than or equal to 10000 being selected regardless of their X or Z coordinates. |
| Lag Slider Minimum | Maximum | Increment | You can control the behaviour of the lag slider with these inputs. The range of values returned by the slider are controlled by the minimum and maximum values while the increment field controls the amount the slider is moved when the buttons either side of the lag slider are used. |
| Treat negative values as (ZEROES | UNDEFINED | NEGATIVES) | Three choices are given for the treatment of negative sample values. If NEGATIVE, they are included in the sample population with their original value. If ZEROES, they are included in the sample population with a value of zero. If UNDEFINED, they are not included in the sample population. |
| Save composited string file | If you wish to save the composites to a string file, select whether to use a TEXT or BINARY format. The composites will be saved to a string file based on the Output report file name. If no Output report file name was specified, the composites will not be saved. The string file will contain the composites that are greater than the minimum length criteria specified in the creation of the variogram. The string file can either be a binary file or text file. The binary format allows the user to accurately recreate the variogram while the text format allows for easy reading of the selected data but will create a slightly different variogram due to the rounding of decimals in the third decimal place. |
- Fill in the fields on the Advanced tab of the Variogram Calculation form
- Click Apply.
A variogram is created based on the information entered on these forms and the Experimental Variogram is displayed.