


Statistics Report
Overview
Function:
You can use this function to display a collection of parametric and non-parametric (robust) statistics for the current variable under the current transformation.
The statistical results can either be viewed on screen or output to a variety of file types.
Fields on the Statistics report form
| Field | Description |
|---|---|
| Output Report File Name | The name and location of the report. |
| Output Report File Format |
The file format for the report. You can choose to save the report as a .not, .csv, .htm, .html, .rft, .pdf or .ps file. |
| Percentile range | The percentiles to report on. This is usually input as the start value, then a comma, the end value, then another comma and the increment value. For example, 10, 100, 10 gives percentile values at an increment of 10 from 10 to 100. |
| Group data |
|
 Note: This field is cleared by default.
Statistical calculations include:
- MEAN
The MEAN is the arithmetic average of the data and is computed by dividing the sum of a set of data by the number of data points.
mean = 
- MEDIAN
The MEDIAN is the middle value in a set of data arranged in ascending order. If there is an even number of data, the MEDIAN is the average of the two middle values.
- GEOMETRIC MEAN
The GEOMETRIC MEAN is an average calculated by multiplying a set of data and taking the nth root, where n is the number of data.
- VARIANCE
The VARIANCE describes the variability of the distribution or the spread of the data
variance = 
- STANDARD DEVIATION
The STANDARD DEVIATION is simply the square root of the variance.
- COEFFICIENT OF VARIATION
The COEFFICIENT OF VARIATION is a measure of the relative variation of the data and is calculated by dividing the standard deviation by the mean of the distribution. It provides a very useful guide to the variability of the data and their subsequent suitability for use in geostatistics. As a general rule, those distributions with a coefficient of variation less than one should produce a reasonable variogram model; if the coefficient of variation is greater than one it implies that the data are quite variable and it is difficult to produce a good variogram model; if the coefficient of variation is greater than two there is virtually no chance of producing a good variogram model.
- MOMENT x ABOUT ARITHMETIC MEAN
Moments about the mean are measures of how widely the data vary from the mean.
The first moment about the mean is zero.
The second moment about the mean is equal to the variance.
The third standardized moment is the skewness.
The fourth standardized moment is the kurtosis.
- SKEWNESS
The SKEWNESS is a measure of the symmetry of the distribution. In a normal distribution, where the distribution is symmetric, the skewness is zero. The skewness is negative for distributions tailing to the left and positive for distributions tailing to the right.
- KURTOSIS
The KURTOSIS is a measure of how peaked the distribution is, or the steepness of ascent near the mode of the distribution. It has a value of zero in a normal distribution and so is a good test for distribution normality. Most gold deposits display a very steep curve near the mode of the distribution so the value for the kurtosis can be expected to be quite high.
- NATURAL LOG MEAN
The NATURAL LOG MEAN is the arithmetic average of the natural logarithms of the data and is computed by dividing the sum of the logarithms of a set of data by the number of data points.
- LOG VARIANCE
The LOG VARIANCE describes the variability of the distribution of the natural logarithms of the data calculated as described above.
- PERCENTILES
Percentiles are the grade at which the specified cumulative frequency percentage of the sample values occurs. The required values are entered either as a range (25,75,25) and/or numbers (25;50;75). The lower quartile is 25%, median is 50% and upper quartile is 75% of the sorted values.
To determine the X percentile out of Y data points, X/100 * Y is used. If the Y is a even number, the next sample is (Y + 1) is added to Y and the total divide by 2. X percentile = (Y + (Y+1))/2
- TRIMEAN
The TRIMEAN is a measure of data dispersion, and is resistant to outlier data.
Trimean = 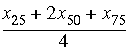
- BIWEIGHT
The BIWEIGHT is a measure of the central tendency of the distribution and is resistant to outlier data.
- MAD
The MAD or Median Absolute Deviation is the middle value of all the absolute deviations from the median and is also very resistant to outlier data.
- ALPHA value
The ALPHA value is the third parameter used in a 3-parameter log normal transformation and is sometimes called the location constant. It is calculated from the cumulative frequency distribution for untransformed data and so only has meaning for reports on raw data. A 3-parameter log normal transformation may be performed by specifying the alpha value for the raw data as the constant in a Natural Log (with constant) transformation.
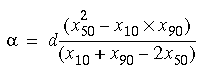
If a is less than or equal to the minimum assay a is set to - 0.99 + the minimum assay.
Where a location constant is used, it is added to each grade before taking logs. The mean etc. includes the constant.
- SICHEL-T estimator
The SICHEL-T estimator is a good estimator of the average of log normally distributed data and overcomes the tendency of the arithmetic mean to overestimate the average. It is a function of the mean, variance and number of samples of the log (base e) transformed data and thus has no meaning with any other transforms. It should be used with great care with geological data since even though they tend to show a highly skewed distribution they are rarely strictly log normal.
Grouped and Ungrouped Data
Calculations for mean, median, geometric mean, variance, standard deviation, coefficient of variation, moments about arithmetic means, skewness, kurtosis, natural log mean, and log variance are provided as:
Ungrouped Data: Calculations are performed using all data points.
Grouped Data: Data are grouped into histogram bins, and the single average value of each bin is used to calculate the statistic.
Procedure
- Choose Statistics > Report.
- Fill in the Statistic Report form.
- Click Apply.
You will see the