


DTM Polynomial Trends
You can use this function to fit a polynomial trend DTM surface to your string data. Analysing the polynomial trend can help you identify global trends in your data. For example, the dominant direction of the gold grade. The higher order the polynomial you fit to your data, the more global highs and lows you will be able to identify. However, the trend will not necessarily be a good fit to the individual input data points.
To run this function: Choose Surfaces > Advanced options > Polynomial trend analysis, or...
 Tip: You will get better results from this function if your data is regularly spaced.
You can use the create grid tools to force your data to be regularly spaced before running DTM POLYNOMIAL TRENDS.
Tip: You will get better results from this function if your data is regularly spaced.
You can use the create grid tools to force your data to be regularly spaced before running DTM POLYNOMIAL TRENDS.
 Note: The higher (that is, quartic and higher) order polynomial surfaces generally give better fits to the data in the region of the data itself.
However, extrapolations beyond the initial data boundary should be treated with caution for these polynomials.
This is demonstrated in the following simple 2D example.
Note: The higher (that is, quartic and higher) order polynomial surfaces generally give better fits to the data in the region of the data itself.
However, extrapolations beyond the initial data boundary should be treated with caution for these polynomials.
This is demonstrated in the following simple 2D example.
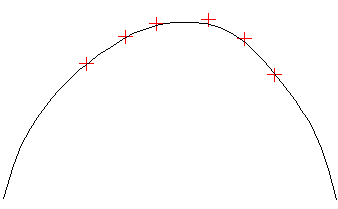
In this example, a polynomial (black line) has been fitted to some initial data (red crosses). The line fits very well to the data inside the region of the data, but continuing the line away from the data following the polynomial can lead to some values that are very different to the initial data. This difference is magnified as the order of the polynomial increases.
Fields on the Polynomial trends form
| Field | Description |
|---|---|
| Input string file | |
| Location | The name and location of the original string file. |
| ID number | The ID number of the original string file. |
| Projection plane | |
| Create on |
The projection plane. Options are:
For a DTM created on the XY plane, the space considered 'above' a DTM is the portion physically above the DTM. The space considered 'below' a DTM is the portion physically below the DTM. For DTMs created on other planes, the space considered 'above' the DTM is in the 'towards' direction of the plane (along the section's Z-axis towards your viewpoint). For example, if a DTM was created using The active plane and the current view plane was:
For the plane of best fit, there are two possible directions that can be considered 'above' the surface (that is, the two normal vectors pointing directly away from either side of the plane). The direction considered 'above' the surface is determined by the following rules:
|
| After creating the surface, change the current plane to the best-fit plane |
|
| Boundary limit string | |
| Location | The name and location of the boundary limit string file. |
| ID number | The ID number of the boundary limit string file. |
| String No | The string number of the boundary limit string in the string file. |
| Segment No | The segment number of the boundary limit string in the string file. |
| Output DTM | |
| Location | The name and location of the output DTM. |
| ID number | The ID number of the output DTM. |
| Object ID | The object ID of the output DTM. |
| Object name | The name of the object for the output DTM. |
| Polynomial surface | |
| Surface to fit |
The type of polynomial surface to fit to your data. Options are:
For example: maximum total power = 2, maximum x power = 2, maximum y power = 2 defines a full quadratic polynomial (which is equivalent to you choosing the QUARTIC type), and maximum total power = 3, maximum x power = 3, maximum y power = 3 defines a full cubic polynomial (which is equivalent to you choosing the CUBIC type). However, maximum total power = 3, maximum x power = 3, maximum y power = 1 limits the terms to give the following polynomial: z = A + Bx + Cy + Dx2 + Exy + Fx3 + Gx2y (that is, the full CUBIC polynomial without some of the terms). If you choose maximum total power = 8, maximum x power = 8, maximum y power = 8, you will get a full eighth order polynomial with no terms missing. |
| Maximum x power | The integer value, between 0 and 10, that defines the maximum x power for the user-defined polynomial. This field is active only if you selected USER DEFINED for the Surface to fit. |
| Maximum y power | The integer value, between 0 and 10, that defines the maximum y power for the user-defined polynomial. This field is active only if you selected USER DEFINED for the Surface to fit. |
| Maximum total power | The integer value, between 0 and 10, that defines the maximum total power for the user-defined polynomial. This field is active only if you selected USER DEFINED for the Surface to fit. |
| Trend surface based on |
|
| X resolution | The X resolution for the output DTM. This resolution determines the grid pattern that new points will be inserted in the new boundary. |
| Y resolution | The Y resolution for the output DTM. This resolution determines the grid pattern that new points will be inserted in the new boundary. |
Output
The new polynomial trend surface DTM is created and saved.
Trouble shooting
| Message | Description |
|---|---|
The defined boundary segment cannot be found in the string file
|
Check that the new boundary does indeed exist in the defined file. |
The boundary segment is open, the new boundary must be closed
|
Check that the new boundary is closed. |
Duplicate points have been found in the boundary segment (search distance = 0.05)
|
Filter duplicate points from the new boundary and re-apply the function. |
Invalid D field for point x= xxx y= yyy z= zzz, calculations will continue ignoring this point
|
Invalid D field found in the initial string data, this point will be ignored. |
Insufficient data points present for calculations to proceed
|
There are not enough initial data points present to accurately fit the required polynomial. |