Sections for plotting
With this function you can extract drill hole sections from a database into string files for plotting. The sections may be of any vertical orientation and are defined by specifying the end points of the first section plane and the projection distances either side of the section plane. Only those samples that fall inside the defined limits will be extracted for plotting. Multiple sections can be extracted at one time by nominating a range of section numbers. All samples that meet the selection criteria will be output to a separate string file for each section.
To run this function: Choose Database > Extract > Sections for plotting, or...
Fields on the Graphics extract sections for plotting form.
Graphics extract sections for plotting form
Location of string files
Enter the location name for the string files that will be generated.
Section Range
Enter the range of sections that you wish to extract. The values that you enter for the section range depend upon the orientation of the section line.
There are three distinct cases which must be considered when defining the section orientation and the associated section range.
These are:
- The section orientation is East-West and you are looking to the North. This is arranged by the left end of the section line being the western most of the section line endpoints.
- The section orientation is North-South and you are looking to the West. This is arranged by the left end of the section line being the southern most of the section line endpoints.
- The section orientation is something other than the two cases described above. That is, oblique to the principal axes, or East-West in orientation and looking South, or North-South in orientation and looking East.
In this case the values entered for the section range must be Northing values.
In this case the values entered for the section range must be Easting values.
In each of these cases the values entered for the section range must be perpendicular distances from the line defined by the section endpoints to each of the subsequent section lines required. Therefore to obtain a section centred about the line defined by the section endpoints, a value of 0 (zero) must be included in the section range.
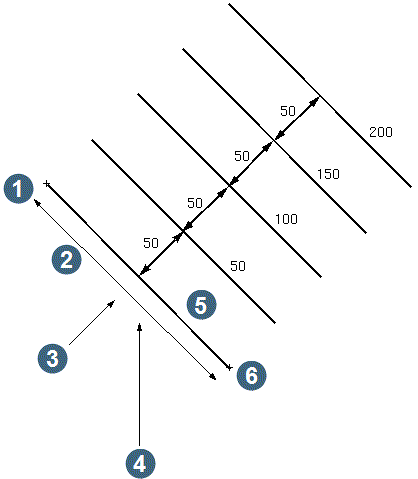
If five sections are required at intervals of 50 metres from the section line then a range of '0,200,50' must be used.
 Note: When the section is oblique, the system generates string 33 000.
This string contains a single point that defines the section line in its D fields. D1 and D2 are the Northing and Easting of the origin, D3 and D4 are the Northing and Easting of the other end of the section.
The PROCESS MAP function can use these coordinates to display where the oblique section crosses relevant Northing or Easting planes.
When displayed in plan view, string 33 000 is located at the South West extreme of the data.
Note: When the section is oblique, the system generates string 33 000.
This string contains a single point that defines the section line in its D fields. D1 and D2 are the Northing and Easting of the origin, D3 and D4 are the Northing and Easting of the other end of the section.
The PROCESS MAP function can use these coordinates to display where the oblique section crosses relevant Northing or Easting planes.
When displayed in plan view, string 33 000 is located at the South West extreme of the data.
The range will control the ID numbers assigned to the output string files, with the first section generated having an ID number taken from the " From " part of the range statement, with subsequent sections having an ID number taken from the " From " part of the range statement plus the " Increment " of the range statement. The " Increment " will also control the distance at which subsequent sections are offset from the initial section end-points.
Define the section orientation
Left end
Enter the coordinates of the left end of the section line.
Right end
Enter the coordinates of the right end of the section line.
Define the section extents
Widths
Enter the projection distance either side of the section plane. The first distance is the distance extending back from the section plane, i.e. extending south for an east-west section, or east from a north-south section. The second distance is the distance extending forward from the section plane.
Z extents
Enter the minimum and maximum elevations for the volume in space in which the drill holes are to be extracted.
Real world coords for oblique sections? (Y/N)
If oblique sections are defined, then the output strings can be stored in real world coordinates or coordinates relative to the most western or southern point of the defined section plane, i.e. Y1,X1. In the latter case the easting in the string file will be relative to this point. The Y1,X1 point will have an easting of zero. The northing will be the distance from the first defined section as in the diagram above. The z coordinate will have the correct elevations.
|
1. y1, x1 2. length 3. view if relative to section 4. view if real world coordinates specified 5. section 0 6. y2, x2 |
Downhole datapoint interval
Enter the interval at which points will be generated for plotting of the drill hole trace. The default value is one point every metre.
Interval for plotting depths
If you wish to plot down hole depths on the drill hole plans, enter the interval at which these are to be extracted. This interval must be a multiple of the downhole datapoint interval entered in the previous prompt. The resulting down hole depths will be stored in the first description field of the drill hole trace string. If down hole depths are not required for plotting then enter a zero, which is the default.
Define the sample tables
Enter the names of up to 5 interval and or point tables from which sample data is to be extracted.
Define the geology tables
Enter the names of up to 5 tables from which geology data is to be extracted.
Define the diplog table
Enter the name of the table from which the diplog information is to be extracted. This table should be a point type table and have optional fields to store the dip, azimuth and quality of the dipmeter readings down the hole. Dipmeter data may be plotted in two styles after extraction from the database:
- Apparent dipstick plots
- Tadpole plots
This is where line segments of a user defined length are drawn beside the drill hole trace and the line segments show the apparent dip of the strata when the dip, dip direction and section orientation are considered. This may be useful when trying to correlate strata in adjacent drill holes.
A separate string file is created which permits an XY plot of each drill hole where the Y axis represents elevation, the X axis represents dip (between 0 and 90) and the azimuth of the dip measurement can be shown by drawing a short line segment where up = zero degrees, down = 180 degrees etc.
Complete the EXTRACT PLANS FOR PLOTTING form and choose Apply to display the DEFINE SAMPLE FIELDS FOR PLOTTING form. This form will be displayed for each of the sample table names which were entered above.
Define sample fields for plotting form
Table
The name of the table from which the sample fields are to be selected is displayed here.
Process each element separately
If more than one sample field is to be extracted, you can choose to control the colour coding of each field separately or by using the colour coding based on the range defined for the first sample field.
Enter "Y" to have each sample field classified independently. Enter "N" to have all sample fields classified into the same class as the values from the first sample field.
Combine adjacent samples
Adjacent samples which have the same value can be combined and plotted as a single value over a longer sample interval by entering "Y" for this input. Enter "N" to have all sample intervals reported individually.
When more than one field is extracted, adjacent samples will only be combined if the following conditions apply:
1) The value of the first sample field of adjacent samples must be equal.
2) If condition (1) is true, then the values from all other fields being extracted must either be numeric, thus permitting length weighted averaging of adjacent samples, or if some or all of the values from the other sample fields are character values, then the values must be identical.
If either of the conditions described above are false, then adjacent samples will not be combined and they will be reported individually.
Define the sample fields and their plotting characteristics
Field Name
Enter the name of the sample field which is to be extracted for plotting.
Class Range
Enter a range (i.e. 0,10,2;999) to classify the values from the sample field into different classes for subsequent plotting. This is particularly useful when you wish to plot values in different colours depending on the magnitude of the value.
To define the class range you must enter a conventional range specification which is interpreted as successive pairs of from and to values.
See the example below:
Class range = 0,10,2;999
Will extract
From >=      To <
0       2
2       4
4       6
6       8
8       10
10      999
A maximum of 10 class can be created for plotting even though you can enter a range which defines many more values.
Any sample values which are greater or less than the range of from and to values defined by the range will be assigned to the first class. In the example above, this means that negative values and values above 999 would be assigned to the same class as the 0 to 2 range.
Treat negatives
This can be set to as nulls or as negatives. If this field is set to as nulls , negative values are plotted as blanks. If this field is set to as negatives, values below zero are saved as negative values and are plotted in the same way as positive values.
Bulking Threshold
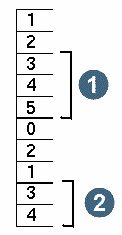
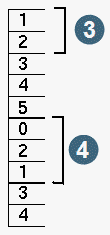
The bulking threshold will control the bulking of consecutive samples that are above or below the threshold. A bulking threshold of zero indicates that bulking is not required. A negative value will generate a bulked value of consecutive samples below the threshold. A positive value will generate a bulked value of consecutive samples above the threshold. The output will report the number of metres of consecutive samples above or below the threshold along with the bulked value.
| bulking threshold = 3 | bulking threshold = -2 | |
|
|
1. 3 m @ 4 2. 2 m @ 3.5 3. 2 m @ 1.5 4. 3 m @ 1 |
No of Decimals
Enter the number of decimal places which are to be used for formatting the sample values for plotting.
Graphs
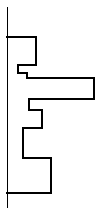
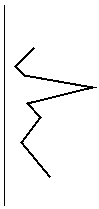
It is possible to create a line or bar (histogram) graph for plotting. If you choose to create graphs this function will create various strings in the resultant string file which can be used to plot the graphs in the Plotting module. Valid entries here are:
- none - no graphs will be created
- line - A string will be created which represents the sample values as a line graph. It is most appropriate to use line graphs when the table from which data is being extracted is a point table.
- bar - A string will be created which represents the sample values as a bar graph or histogram. It is most appropriate to use bar graphs when the table from which data is being extracted is an interval table.
An important feature of bar graphs, with respect to plotting, is that the bar graph is comprised of a number of closed segments. The D1 field of the closed segments of the bar graph will have the class number, i.e. 1 or 2 or 3, etc. stored in it. This is particularly useful as it makes it possible to then use the pattern fill or colour fill capabilities of the PLOTTING module, to use different patterns or colours for different class ranges when plotting the final results.
See the diagram below for examples of typical graphs.
| bar graph | line graph |
|
|
Graph Location
If graphs have been selected you can choose whether to plot the graphs on the left hand side or right hand side of the drill hole trace.
Length per Unit
If graphs have been selected then you can control the size of the graphs by entering the length per sample value unit here.
Maximum Value
If graphs have been selected then you can limit the maximum size of the graph, that is, the maximum offset from the drill hole trace, by entering a maximum graph value here. Any sample values which exceed this value will be graphed as though they were equal to the maximum graph value.
Complete the DEFINE SAMPLE FIELDS FOR PLOTTING form and choose Apply to display the DEFINE GEOLOGY FIELDS form. This form will be displayed for each of the sample table names which are entered above.
Define geology fields form
Table
The name of the geology table is displayed here.
Geology type to plot
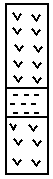
Geology will be extracted to the string file as `symbolic' geology and `literal' geology.
- literal - Literal geology will extract geology data and save it in the string file in different description fields. This is intended for plotting the geology data as textual information on the plot.
- symbolic - Symbolic geology is extracted as a closed string segment along with the geology code in the D1 field. This ensures that fill entities and lookup tables for pattern selection based on the geology code can be used when processing with the Plotting module.
For example,
| Depth_from | Depth_to | ROCK |
|---|---|---|
| 0 | 5 | And |
| 5 | 7 | BRC |
| 7 | 10 | And |
| literal geology | symbolic geology | |
|
|
1. And 2. BRC |
Combine adjacent samples
If adjacent geology samples have identical sample values then the samples can be combined and reported as a single longer interval.
Define the geology fields and their plotting characteristics
Field Name
Enter the name of the field in the geology table which is to be included in the plot.
Geology Location
You must indicate the location of the graph by entering `left' or `right'.
Box Size
You must enter the width, in real world units, for the size of the box which will be created.
Complete the DEFINE GEOLOGY FIELDS form and choose Apply to display the DEFINE DIPMETER DATA form. This form will only be displayed if a diplog table name was entered.
Define Dipmeter data form
Table
Display only. The name of diplog table is displayed here.
Dip field name
Enter the name of the field in the diplog table containing the dip value.
Azimuth field name
Enter the name of the field in the diplog table containing the azimuth value.
Quality field name
Enter the name of the field in the diplog table containing the quality value of the dip and azimuth reading. This must have been entered as a value between `a' and `e' where `a' indicates a good reading and `e' indicates a poor reading. Case (i.e. upper or lower) of the quality values is irrelevant.
Dip segment position
Indicate whether you want the dip meter's to be plotted on the left or right of the drill hole trace.
Dip segment length
Enter the length in real world units of the size of the dip meter segment lengths to be plotted.
Dip segment offset
Enter the offset from the drill hole trace in real world units that the centre of the dip meter segments are to be plotted.
Tadpole location
Enter the location name of the string file which will contain the tadpole grid and point values. The ID will be taken from the section ID. If this field is left blank, then a tadpole string file will not be created.
Tadpole tail length
Enter the length in real world units of the length of the tadpole line segment to be plotted.
Elevation grid interval
Enter the interval of the elevation grid lines on the y-axis of the tadpole grid.
Dip grid interval
Enter the interval of the dip grid lines on the x-axis of the tadpole grid.
Dip scale (deg/plot unit)
Enter the number of degrees per plot unit for the dipmeter plot dip axis.
Number of dip grid intervals
Enter the number of grid intervals to define the maximum grid value on the x-axis of the tadpole grid. For example, if 5 was entered above for the Dip grid interval and 6 entered here for the Number of dip grid intervals, then the maximum x-axis grid value will be 30.
Complete the DEFINE DIPMETER DATA form and choose Apply to display the DEFINE QUERY CONSTRAINTS form. See Selecting Data To Be Processed.
Complete the DEFINE QUERY CONSTRAINTS form and choose Apply to commence the processing of the data, and return to the EXTRACTING STRINGS submenu.
Messages
Upon completion of processing the names of the output string files will be displayed in the message window.
Result
The output from VERTICAL SECTIONS FOR PLOTTING is a series of string files containing the selected information for holes that match the hole selection criteria. There will be one string file for each section you have selected, with a location name that you have specified and an ID number equal to each section value. The structure of each string file is such that you can set up permanent map definitions in the PLOTTING menu which refer to the specific string numbers in which the selected information is stored. A summary of the string numbers output for each string file is given below:
| String | Description |
| 1 | Hole trace for holes entirely within extraction limits. |
| 2 | Hole trace for holes which start outside the extraction limits, but finish inside the extraction limits. |
| 3 | Hole trace for holes which start inside the extraction limits but finish outside the extraction limits. |
| 4 | Hole trace for holes that start and finish outside the extraction limits. |
| 5 | Top, bottom and down hole survey depths with survey data stored in the D fields. |
| 6 | The point at which the hole trace crosses the extraction plane. |
| 11 | The first interval sample grade range string, for the first sample table, with different elements stored in the D fields in the order in which they were selected (second table = 111, third = 211 etc). |
| 12 | The second and subsequent interval sample grade range strings, for the first sample table with different elements stored in the D fields in the order in which they were selected ( second table = 112, third = 212 etc). |
| 21 | The interval sample bar graph strings for the first selected element (or the first sample table), with the grade range in the D field (second table = 121, third = 221 etc). |
| 22 | The interval sample bar graph strings for the second and subsequent selected elements, for the first sample table with the grade range in the D field (second table = 122, third = 222 etc). |
| 31 | The interval bulked sample string for the first selected element, for the first sample table (second table = 131, third = 231 etc) |
| 32 | The interval bulked assay strings for the second and subsequent selected elements, for the first sample table (second table = 132, third = 232 etc). |
| 41 | The first point sample grade range string with different elements stored in the D fields for the first sample table, in the order in which they were selected (second table = 141, third = 241 etc). |
| 42 | The second and subsequent interval sample grade range strings with different elements stored in the D fields for the first sample table in the order in which they were selected (second table = 142, third = 242 etc). |
| 51 | The line graph string for the first selected element, in the order in which they were selected (second table = 151, third = 251 etc). |
| 52 | The line graph string for the second and subsequent selected elements, in the order in which they were selected (second table = 152, third = 252 etc). |
| 70 | The literal geology string for the first sample table with the different geology fields stored in the D fields in the order in which they were selected (second table = 170, third = 270 etc). |
| 71 | The symbolic geology box strings for each geology field that has been selected with the literal geology codes in the D field, in the order in which they were selected (second table = 171, third = 271 etc). |
| 81 - 90 | Geology trace for each geology field for the drill hole display module. |
Strings 1 to 4 contain the drill hole trace strings for all of the holes extracted for plotting. Only the portion of the hole which lies within the extraction limits is extracted, so that special plot entities can be used to correctly display those holes which enter or leave the extraction limits.
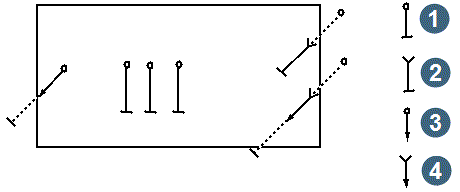
|
1. entity for string 1 2. entity for string 2 3. entity for string 3 4. entity for string 4 |
The number of points defining the drill hole trace is determined by the answer to the question Downhole datapoint interval given in the EXTRACT SECTIONS FOR PLOTTING form. If you entered a value for Interval for plotting depths in the same form, the downhole depths will be stored in the D field of the drill hole trace string.
String 5 contains at least two points for each drill hole that has met the selection criteria. These points are for the top of the hole or the position where the hole enters the extraction limits, and the bottom of the hole or the position where the hole leaves the extraction limits. Each point in this string will have the following information stored in the D fields:
| D1 | hole_id |
| D2 | depth |
| D3 | dip |
| D4 | azimuth |
String 6 will contain one point for each drill hole that intersects the section plane. If a drill hole does not intersect the section plane, such as a vertical drill hole, then no point will be stored for that hole.
Strings 11 to 20 will contain interval assay data for the selected elements, with each string representing a different grade range. If you answered `Y' to the prompt Process each element separately in the EXTRACT SECTIONS FOR PLOTTING form, then String 11 will contain all the values for each selected element in the first grade range for each individual element, String 12 will contain all the values for each selected element in the second grade range for each individual element, and so on. If you answered `N' to the prompt Process each element separately in the EXTRACT SECTIONS FOR PLOTTING form, then String 11 will contain the values for each selected element in the first grade range of the first selected element. The second and subsequent selected elements for the samples in this string will be stored in this string regardless of their own value. String 12 will contain the values for each selected element in the second grade range of the first selected element, and so on. The actual data point stored for each of these strings represents the end point of the selected sample.
Strings 21 to 30 will contain bar graphs for selected elements, with one string number used for each selected element. These bar graph strings are closed segment boxes with the grade range number for each box stored in the D field so that fill entities can be applied when using the plotting module.
Strings 31 to 40 will contain the bulked sample data with one string number for each selected element. The bulked grades and lengths are stored in the D field at the point at the end of the bulked interval in the form `10m @ 25'.
Strings 41 to 50 will contain point sample data for the selected elements, with each string representing a different grade range. If you answered `Y' to the prompt Process each element separately in the EXTRACT SECTIONS FOR PLOTTING form, then String 41 will contain all the values for each selected element in the first grade range for each individual element, String 42 will contain all the values for each selected element in the second grade range for each individual element, and so on. If you answered `N' to the prompt Process each
element separately in the EXTRACT SECTIONS FOR PLOTTING form, then String 41 will contain the values for each selected element in the first grade range of the first selected element. The second and subsequent selected elements for the samples in this string will be stored in this string regardless of their own value. String 42 will contain the values for each selected element in the second grade range of the first selected element, and so on.
Strings 51 to 60 will contain line graphs for selected elements, with one string number used for each selected element. If the line graphs are created from interval sample data then the graph points are located half way along each sample length.
String 70 will contain the literal geology codes with selected geology fields stored in individual D fields. The actual data point stored for each of these strings represents the end point of the selected sample.
Strings 71 to 80 will contain the closed box segments for plotting symbolic geology, with one string number for each selected symbolic geology field. A closed box segment is created for each geological code, with the literal geology code stored in the D field so that fill entities can be used in the plotting module. The boxes will be offset from the drill hole trace by the box thickness.
String 91 contains the dipmeter values with each dipmeter reading stored in a point down the drill hole trace. The dip, azimuth and quality values are each stored in the D1, D2 and D3 fields of each point for plotting.
String 92 contains the actual dipmeter line segments as defined on the DEFINE DIPMETER DATA form with the dip, azimuth and quality value stored in the D1, D2 and D3 fields. These can be plotted out using a line entity.
Tadpole String File
If a tadpole string file was nominated by specifying a location name, then one string file will be created for each section that you have selected, with an ID number equal to each section value. The structure of each string file is such that you can set up permanent map and entity definitions in the PLOTTING menu which refer to the specific string numbers in which the selected information is stored. A summary of the string numbers output for each tadpole string file is:
Strings1 and 2 contain the tadpole grid string lines with the grid value stored in the D1 field for plotting grid annotations.
Strings 3 to 7 contain the tadpole line segments, with a different string number being created for each quality.
This allows for entities to be set up to plot out each tadpole in a different way depending on the quality of the reading.
The main purpose of this function is to extract information from the database into string files for plotting in the PLOTTING menu. Depending on whether you have also extracted strings for edit or display, these string files can be used in the GRAPHICS module using the DRILL HOLE function for graphical interaction with the database and on screen digitising of geological outlines.