


Graphical log
This function allows you to create a detailed graphical log which shows geological data as lithological patterns, bars, lines, textual description, or depth marks. The data is taken from a geological database.
Prerequisites: A geological database is open.
To run this function: Choose Database > Report > Graphical log, or...
Fields on the Log format file form
The first time you run this function, fill in the Graphical drillhole log form to specify which data to include in the log. There are two sections to this form. The top half of the form relates to the entire log, the second half of the form defines a set of columns. Each column can have a different type. A tab appears in the middle of the form for each column described for the log. Click on that heading, to display the details of that column.
Fields on the Graphical drillhole log form
The following fields appear on the top half of the form, and apply to the entire log.
| Field | Description |
|---|---|
| Paper Size | The paper size of the log. To add more paper sizes, or modify the existing ones, change the paper sizes in SSI_PLOTTING:user.chr. |
| Orientation | The orientation of the paper: Portrait or Landscape. |
| Plot Type |
|
| Scale | The scale is in the y down hole direction only. The horizontal scale is only changeable by modifying the size of the columns in the log. Scale relates to metres down the hole. So therefore, a scale of 100 maps 1 metre down the hole to 1 centimetre on the log plot. A scale of 1 would create a log where 1 metre down the hole equals 1 metre on the log plot. |
| Label Interval |
Several of the column types use this value to determine the interval required for displaying labels and horizontal lines, allowing you to line up the columns of the log. It is measured in units downhole, so a value of 5 outputs a label every 5 metres down the hole. A depths column outputs the depth at this interval, and graph columns have a dotted line horizontally across them at this interval. |
| Left Margin | The left margin is the offset from the left of the paper at which the left side of the plot is placed. It is measured in centimetres, so a left margin of 2 offsets the whole log 2 centimetres from the left of the page. |
| Depth from | The depth at which the log starts. You must enter Depth from so that all holes line up according to downhole depth. |
| Depth to | Depth to is the upper limit of the samples to be output. You must enter Depth to to produce a log successfully. Depth to must be greater than the Depth from value. |
| Lookup File |
A lookup file is used to match geological codes to a particular pattern in the pattern file. This is used for columns such as Lithology and Bar Graphs. The value of the geological rock code in the database is matched against a value in the lookup file, and a matching pattern is found. If no value in the lookup file is found, Surpac looks for a pattern called "default" in the pattern file. There is no pattern "default" currently in the pattern file, so if you want a particular pattern to be displayed whenever a value cannot be found in the lookup file, create the pattern "default" in the pattern file. You can edit the patterns defined for each rock type by modifying the patterns.ssi file using LOOKUP FILE EDIT. If no lookup file is specified, the patterns used to match geology codes are taken from the styles table. You can define these patterns using the EDIT DRILLHOLE STYLES function. |
| Pattern File | The file that defines the patterns for the rock code values in a lithology or bar graph column. If Surpac cannot find a pattern name, a simple 45 degree, solid line hatching pattern is used. |
| Add | Adds a new tab in the lower part of the form so you can specify another item of data from the drillhole database to include in the drillhole log. |
| Insert | Adds a new tab in the lower part of the form, before the tab that is currently active. |
| Remove | Removes the tab in the lower part of the form that is currently active. |
The fields that appear on each tab in the lower half of the form, depend on the Column Type you choose. For each column you want to see in the drillhole log, click the Add button, and enter the details. The common column details are Heading, Column type, Col. width, Interval , Grid, Table and Fields. Variable details and the columns they are associated with are described in the following table below.
| Column Type | Table Types | Field Types | No. Fields | Optional Fields |
| Lithology | Interval | Character | 1 | Pattern |
| Line Graph | Point Interval |
Numerical | 20 | Min Max |
| Bar Graph | Interval | Field 1 - Numerical Field 2 - Character |
2 | Min Max Pattern |
| Depths | None | None | 0 | Orientation No.Decimals Minor Ticks Font options |
| Description | Point Interval |
Character Numerical |
5 | Horizontal justification Vertical justification Font options |
| Bar / Line | Field 1 - Interval Field 2+ - Both |
Field 1 - Numerical Field 2 - Numerical or Character Field 3+ - Numerical |
20 | Min Max Pattern |
Common fields
| Field | Description |
|---|---|
| Heading |
The heading for the column. The name of the tab for the column changes to show the heading entered. |
| Column Type |
There are six column types.
|
| Col. Width |
The column width in centimetres. |
| Interval |
The space to be left between this column and the column directly to the right of it. |
| Grid |
This field only has value for the graph column types. It allows you to turn on and off the dotted horizontal lines. On, horizontal dotted lines are drawn at the specified label interval. Off, no lines are drawn. |
| Table |
This is the table that the information for this hole will come out of. Some column types only accept interval data, and some accept both point and interval data. This was identified in the previous bullet list. |
| Fields |
In this scroll block, you should enter the fields in the selected table from which the data is to be retrieved. Some columns allow the input of several fields. Others allow only one field to be entered here. The order of the fields entered (for example, in the Line Graph) determines the order of output. |
 Tip: To see which pattern is used for a particular lithology code, run LOOKUP FILE EDIT.
Variable fields
The following fields appear for some column types. They do not appear for all columns.
| Field | Description |
|---|---|
| Pattern |
The pattern used for a lithograph or columns in a bar graph. |
| Min |
This field is for the graph columns, and defines a minimum value for the column. Any values below this minimum are assumed to be this minimum value. |
| Max |
This field is for the graph columns, and defines a maximum value for the column. Any values above this maximum are assumed to be this maximum value. |
| Orientation |
The text columns can be aligned to either the left or the right. This orientation value defines whether the current column is aligned left or right. |
| No. Decimals |
Enter the number of decimal places required here. The more decimal places, the higher the precision, but generally, the smaller the text size. The more decimals that have to be output, the more characters must fit into the same size space, and so the text is shrunk. |
| Minor Ticks |
Only applicable to a depths column, this value holds the number of intervals between labels drawn on the page. For example, if you have labels drawn at 5 metres, you might want 5 minor ticks, placing a small tick at each metre down the hole. |
| Horizontal justification |
Sets the text in the column to be left, centre or right aligned on the horizontal plane. |
| Vertical justification |
Sets the text in the column to be top, centre, or bottom aligned on the vertical plane. |
| Font options |
Controls the appearance of the text in the log. You can choose the font type using the Name drop down, select Bold, Italic or Underline using the check boxes and define the size of the text using the Text height field. |
When you apply this form, all of the inputs are validated. Any
data which does not pass the validation process is reported in the Message window, and the same form is redisplayed. When all data
is entered and correct, the Drillhole log title form is displayed. On this form, you can enter details
of the heading information that is required for the log.
Drillhole log title
There are three layers of heading information. The first is the title
block. These are defined the same as the title blocks in plotting,
using the SSI_PLOTTING:user.chr file. The title block is plotted once,
at the top of each log. However, there are some differences. The title
blocks in Graphical Logs cannot use some of the functions available to
plotting title blocks.
The functions not available are:
- Scale Bars - are not relevant as the scale only works in the downhole direction, and the depths are printed on the log (with a Depths column).
- Legend - are not required by the graphical logs. If you want to print a legend, use the Lookup File Editor.
 Note: You can now output images in title blocks. In versions of Surpac before 6.6.2, it was not possible to output an image in a title block in a drillhole log.
The second layer of title information is the hole information. Hole information is plotted once at the top of the log, below the title block, but before the log itself. You can selectively include x, y, z coordinates, dip, and azimuth, or you can leave the hole information out altogether.
Finally there is a layer which contains the column headings for all columns. This layer of headings is plotted at the top of each page. Surpac tries to fit the text of the heading in the space available, but if the column size is small, or the text size is large, the text may be truncated.
Drillhole log title form
| Field | Description |
|---|---|
| Title Block |
This is the title block to use. All available title blocks are in the browser, so select the required one. Use NOTB for no title block. After the title block required is selected, the Title scrolling region fills with the appropriate title prompts for you to enter the required title line information. |
| Title |
The grid includes title lines for you to enter text to define the log correctly. After the title block name is selected, this scrolling region prompts you for the title lines required. |
| Column Headers |
These print on each page, and contain the column titles entered on the previous form. |
| Include? |
|
| Font options |
Controls the appearance of the text in the log. You can choose the font type using the Name drop down, select Bold, Italic and/or Underline using the check boxes and define the size of the text using the Text height field. |
| Hole Information |
This is plotted at the top of the log only. If you have a multi hole plot, the hole information splits itself so that the correct hole information is displayed over the correct columns. |
| Include? |
|
| No. Decimals |
Specifies the number of decimal places for the output. All extra hole information is numeric, but the number of decimal places can greatly affect how the log looks, so if absolute precision is not required, a smaller number of decimal places can produce a log that is easier to read. |
| Coordinates |
Select if you want to include the x, y, and z coordinates of the collar. |
| Dip |
Select to include the dip at the collar. |
| Azimuth |
Select to include the azimuth value of the hole at the collar survey. |
| Font options |
Controls the appearance of the text in the log. You can choose the font type using the Name drop down, select Bold, Italic or Underline using the check boxes and define the size of the text using the Text height field. The default size of 0.2 is a reasonable size. |
| Information label |
A text label to append to a heading field. This is optional. |
| Field |
The field to append to the Information label. |
Selecting Holes
The Select holes form appears, and you can enter the holes to be processed.
This form controls which holes from the database are logged. If the form is empty, all holes in the database are logged according to the format. Otherwise, enter the hole id exactly as it appears in the database. If you have selected the holes graphically, the hole ids appear in the form automatically. If you enter a hole id that does not exist, a log is still created, but it contains no data. You should then revise the hole id, and use the same format to output another log.
Logs are output in the order that the holes are entered in the Select holes form.
For multi hole logs, there is an extra piece of information provided. This tells you how many holes fit on a single log, according to the size of the log format that you have defined. If the limit is given as 3, and you enter 5 holes, you get 2 logs, one containing the first 3 holes, the other containing the remaining 2 holes. To fit more holes on a log, either change the paper size or orientation, or make the columns in the format smaller.
After this form is applied, the logs are created, and a message is displayed showing you the name of the log files.
Output
A .dwf file is created that shows a graphical representation of the drillhole, including the additional drillhole data that you specified. You can open the .dwf file in a plot editor.
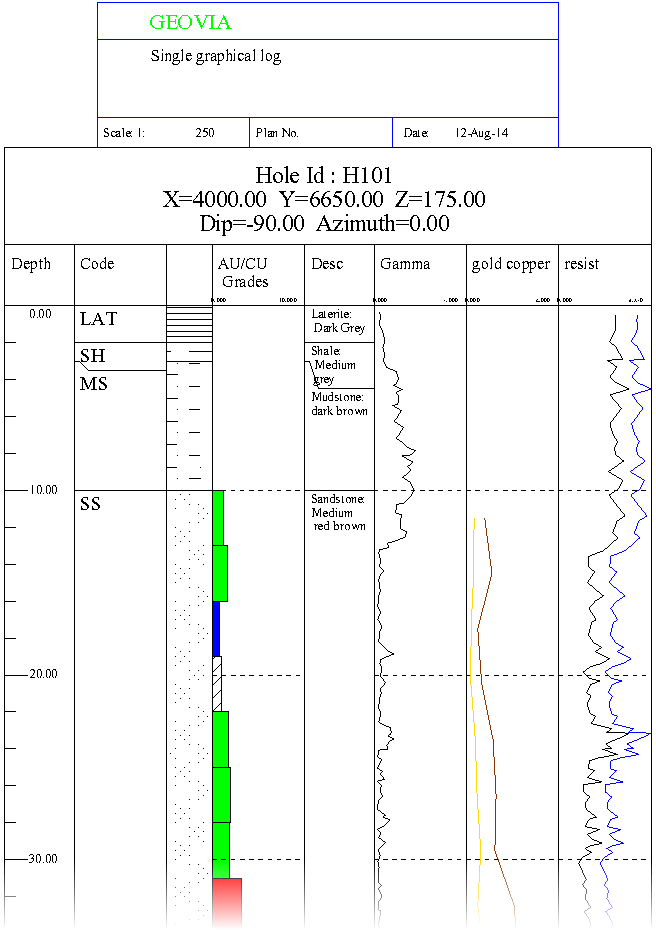
For an example, you could specify the following data for a single hole log by adding 8 tabs to the Graphical drillhole log form. To use a similar example with your data, you must make sure that you capture and store similar data in your database.
Plot Type: Single Hole, Log Properties. Scale: 250. Label Interval: 10. Depth to: 250.
1. Depth. Column Type: Depths. Minor Ticks: 5.
2. Code. Column Type: Description. Table: geology. Fields: rock_code.
3. Column Type: Lithology. Pattern: 100. Table: geology. Fields: rock_code.
4. AU/CU Grades. Column Type: Bar Graph. Min 0. Max 10. Pattern: 250. Table: assay. Fields: cu_grade, ore_class. (The ore_class values are HG, MG, and LG, for which the example uses pen numbers 4, 3, and 2 respectively).
5. Desc. Column Type: Description. Table: geology. Fields: description.
6. Gamma. Column Type: Line Graph. Min 0. Max 5. Table: gamma. Fields: gamma.
7. gold copper. Column Type: Line Graph. Min 0. Max 6. Table: assay. Fields: au_grade, cu_grade
8. resist. Column Type: Line Graph. Table: resistivity. Fields: resistivity, resist2
Error Messages
| Message | Description |
|---|---|
Zero scale is not permitted
|
You have entered a zero scale for the log |
The specified lookup file does not exist
|
You have specified a lookup file that does not exist. |
The specified pattern file does not exist
|
You have specified a pattern file which does not exist. |
No table was specified for column X
|
The column (x) either has no table specified, or the format was created for a different database, and the table does not exist in this database. |
No fields have been specified for column X
|
Column x is of a type that expects fields, but none have been entered. This either means none have been entered, or the fields specified do not exist in the current database. |
The log specifications given fall outside the sizev of the sheet
|
The overall size of the log format is larger than the x size of the paper specified. Either change the paper size or orientation, or decrease the size of the specified format. |
Column X has a width of zero. All columns must have a width
|
All columns must have a width. Column x apparently does not have a width. |
Selected sheet size does not exist
|
You have selected a sheet size that does not exist. |
The left margin value must be positive
|
The left margin is the distance in centimetres from the left of the page. It must be either zero or a positive number. |
Entered depth_from value is less than zero. Depth_from must be a positive value
|
The depth from cannot be a negative number. |
Depth_to value must be larger than the depth_from value
|
The depth_to value must be larger than the depth_from value to have any use. Make sure this is the case. |
Unknown log type. Must be selected as either a single hole or multi hole plot
|
The log type either could not be found, or is incorrect. Use a correct log type. |
Column X has a negative interval. Intervals must be positive
|
The interval between one column and the column to the right of it must be positive. |
Column X is of unknown type. Please enter a correct column
|
An incorrect type has been entered. Enter a correct column type. |