


Extract plans
This function is almost identical to the EXTRACT PLANS FOR PLOT function. The significant difference is that this function, in addition to extracting plan sections from the Geological Database and saving them to string files, draws the resultant plans on the screen immediately the data has been extracted.
Function Name:
Location of string files
Enter the location name for the string files that will be generated. The ID number of each string file will be set to each plan elevation that is selected.
Z Range
Enter the range of plan elevations that you wish to extract drill hole data for.
For example, if you wish to extract plans every 50 metres, you may specify a distance either side of 25 and a range of elevations as 50, 200, 50. This would create four string files containing drill hole information at elevations of 50 +/- 25, 100 +/- 25, 150 +/- 25 and 200 +/- 25.
Define the plan extents and heights
above and below the plane
Y extents
Enter the minimum and maximum Y value of the area within which you wish to extract drill hole data.
X extents
Enter the minimum and maximum X value of the area within which you wish to extract drill hole data.
Z extents
Enter the projection distance either side of the plan elevation. The first distance is the distance extending below the plan elevation, while the second distance is the distance extending above the plan elevation.
Downhole datapoint interval
Enter the interval at which points will be generated for plotting of the drill hole trace. The default value is one point every metre. For vertical holes you may wish to enter a larger number to reduce the number of points created.
Interval for plotting depths
If you wish to plot down hole depths on the drill hole plans, enter the interval at which these are to be extracted. This interval must be a multiple of the downhole datapoint interval entered in the previous prompt. The resulting down hole depths will be stored in the first description field of the drill hole trace string. If down hole depths are not required for plotting then enter a zero, which is the default.
Define the sample tables
Enter the names of up to 5 tables from which sample data is to be extracted and included in the string files created by this function. It is useful to be able to extract data from more than one sample table at a time when samples have been recorded at different intervals down the drill hole.
Define the geology tables
Enter the names of up to 5 tables from which geology data is to be extracted and included in the string files created by this function. It is useful to be able to extract data from more than one geology table at a time when samples have been recorded at different intervals down the drill hole.
Select drill holes graphically
The drill holes which are to be included in the plan may either be defined using the standard DEFINE QUERY CONSTRAINTS form or by selecting the drill holes graphically by using the mouse.
Note:To select the drill holes graphically you must first have used the GRAPHICS DRILL LAYOUT function to extract and display drill hole collar data in the appropriate fashion.
Enter "Y" to select the drill holes for inclusion on the plan graphically using the mouse. Enter "N" to use the standard DEFINE QUERY CONSTRAINTS form to define the drills holes which are to included in the plan.
Complete the GRAPHICS EXTRACT PLANS FOR PLOT form and choose Apply to display the DEFINE SAMPLE FIELDS FOR PLOTTING form.
Table
The name of the table from which the sample fields are to be selected is displayed here.
Process each element separately
If more than one sample field is to be extracted, you can choose whether to control the colour coding of each field separately or by using the colour coding base on the range defined for the first sample field.
Enter "Y" to have each sample field classified independently using its own class range. Enter "N" to have all sample fields classified into the same class as the values from the first sample field.
Combine adjacent samples
Adjacent samples which have the same value can be combined and plotted as a single value over a longer sample interval by entering "Y" for this input. Enter "N" to have all sample intervals reported individually.
Any sample values which fall outside the range of from and to values defined by the range will be assigned to the first class.
There are some conditions associated with combining adjacent samples into a single interval. These conditions apply when more than one field is being extracted for plotting. Adjacent samples will only be combined into a longer interval if the following conditions apply:
1) To determine if adjacent samples are to be combined the values if the first sample field of the adjacent samples must be equal.
2) If condition (1) is true, then the values from all other fields which are being extracted must either be numeric, thus permitting length weighted averaging of the adjacent samples, or if some or all of the values from the other sample fields are character values, then the values must be identical.
If either of the conditions described above are false, then adjacent samples will not be combined and they will be reported individually.
Define the sample fields and their plotting characteristics
Field name
Enter the name of the sample field which is to be extracted for plotting.
Class Range
Enter a range (i.e. 0,10,2;999) to classify the values from the sample field into different classes for subsequent plotting. This is particularly useful when you wish to plot values in different colours depending on the magnitude of the value.
To define the class range you must enter a conventional range specification which is interpreted as successive pairs of from and to values. See the example below:
Class range = 0,10,2;999
Translates to
From >=      To <
0       2
2       4
4       6
6       8
8       10
10      999
A maximum of 10 class can be created for plotting even though you can enter a range which defines many more values.
Any sample values which are greater or less than the range of from and to values defined by the range will be assigned to the first class. In the example above, this means that negative values and values above 999 would be assigned to the same class as the 0 to 2 range.
Treat negatives
This can be set to as nulls or as negatives. If this field is set to as nulls , negative values are plotted as blanks. If this field is set to as negatives, values below zero are saved as negative values and are plotted in the same way as positive values.
Bulking Threshold
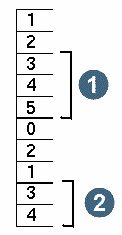
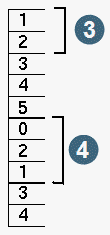
The bulking threshold will control the bulking of consecutive samples that are above or below the threshold. A bulking threshold of zero indicates that bulking is not required. A negative value will generate a bulked value of consecutive samples below the threshold. A positive value will generate a bulked value of consecutive samples above the threshold. The output will report the number of metres of consecutive samples above or below the threshold along with the bulked value.
| bulking threshold = 3 | bulking threshold = -2 | |
|
|
1. 3 m @ 4 2. 2 m @ 3.5 3. 2 m @ 1.5 4. 3 m @ 1 |
No of Decimals
Enter the number of decimal places which are to be used for formatting the sample values for plotting.
Graphs
It is possible to create a line or bar (histogram) graph for plotting. These graphs are useful as a visual means of inspecting the results on a hardcopy plot and making high grade values stand out significantly. If you choose to create graphs this function will create various strings in the resultant string file which can be used to plot the graphs in the Plotting module. Valid entries here are:
- none - no graphs will be created
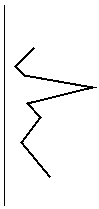
- line - A string will be created which represents the sample values as a line graph. It is most appropriate to use line graphs when the table from which data is being extracted is a point table.
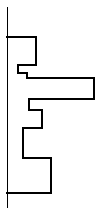
- bar - A string will be created which represents the sample values as a bar graph or histogram. It is most appropriate to use bar graphs when the table from which data is being extracted is an interval table.
An important feature of bar graphs, with respect to plotting, is that the bar graph is comprised of a number of closed segments. This is significant when you consider the further processing of this data by the Plotting module. The D1 field of the closed segments of the bar graph will have the class number, i.e. 1 or 2 or 3, etc. stored in it. This is particularly useful as it makes it possible to then use the pattern fill or colour fill capabilities of the Plotting module and the pattern selection method using a lookup file to use different patterns or colours for different class ranges when plotting the final results.
See the diagram below for examples of typical graphs.
| bar graph | line graph |
|
|
Graph Location
If graphs have been selected you can choose whether to plot the graphs on the left hand side or right hand side of the drill hole trace. To choose which side of the hole trace the graphs are required simply enter "left" or "right".
Length per Unit
If graphs have been selected then you can control the size of the graphs by entering the length per sample value unit here.
Maximum Value
If graphs have been selected then you can limit the maximum size of the graph, that is, the maximum offset from the drill hole trace, by entering a maximum graph value here. Any sample values which exceed this value will be graphed as though they were equal to the maximum graph value.
Complete the DEFINE SAMPLE FIELDS FOR PLOTTING form and choose Apply to display the DEFINE GEOLOGY FIELDS form. This form will be displayed for each of the sample table names which are entered above.
Fields on the Define geology fields form
Table
The name of the geology table is displayed here.
Geology type to plot
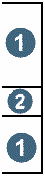
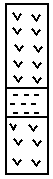
Geology will be extracted to the string file as either `symbolic' geology and `literal' geology. All geology fields for the table will be extracted in the same way.
- literal - Literal geology will extract geology data and save it in the string file in different description fields. This is intended for plotting the geology data as textual information on the plot.
- symbolic - Symbolic geology is extracted as a closed string segment along with the geology code in the D1 field. This ensures that fill entities and lookup tables for pattern selection based on the geology code can be used when processing with the Plotting module.
For example,
| Depth_from | Depth_to | ROCK |
|---|---|---|
| 0 | 5 | And |
| 5 | 7 | BRC |
| 7 | 10 | And |
| literal geology | symbolic geology | |
|
|
1. And 2. BRC |
Combine adjacent samples
If adjacent geology samples have identical sample values then the samples can be combined and reported as a single longer interval. Enter "Y" to combine adjacent samples otherwise enter "N".
Define the geology fields and their plotting characteristics
Field Name
Enter the name of the field in the geology table which is to be included in the plot.
Geology Location
You must indicate the location of the graph by entering `left' or `right'.
Box Size
You must enter the width, in real world units, for the size of the box which will be created. A typical value is 5.
Complete the DEFINE GEOLOGY FIELDS form and choose Apply to proceed to the next step of defining the drill holes which are to be included in the plan.
If you chose to select the drill holes graphically then the following prompt will be displayed:
Select a drill hole. Press ESC when selection is complete.
Using the mouse, select each of the drill holes which are to be included in the plan. It is only valid to select points which have been displayed by using the GRAPHICS DRILL HOLE LAYOUT function. Continue selecting drill holes with the mouse until all required drill holes have been selected.
When you have completed the graphical selection of drill holes, press Escape to display the DEFINE THE REQUIRED DRILL HOLES form.
The drill hole identifiers of all the holes which were selected using the mouse are displayed on a scrolling region on this form. You may edit this list, delete hole IDs from or add more holes IDs to the list.
Complete the DEFINE THE REQUIRED DRILL HOLES form and choose Apply to commence extracting the data from the Geological Database.
If you did not choose to select the drill holes graphically then the standard DEFINE QUERY CONSTRAINTS for will be displayed to permit you to limit the data to be processed by using normal query constraints.
Complete the DEFINE QUERY CONSTRAINTS form and choose Apply to commence extracting the data from the Geological Database.
When extraction and processing of the data is completed each of the plans are displayed in the graphics module.