


Extract section fence diagram
You can use this function to construct a sectional diagram through a sequence of drillholes.
A sectional fence is the longitudinal section extracted from a series of drillholes that you graphically select. The string file created from this data preserves both the order in which you selected the drillholes, and the distances between selected holes. Creating sectional fences is an effective way to extract qualitative geological data for plotting purposes.
Prerequisites:
- A geological database is connected and the drillholes are displayed in Graphics.
To run this function: Choose Database > Extract > Section fence diagram for plotting, or...
A prompt to select drillholes to add to the fence diagram is displayed.
You need to select a minimum of two drillholes. The maximum number of drillholes you can select is 100.
After you have selected the drillholes and pressed ESC the Extract section fence diagram for plotting form opens.
Fields on the Extract section fence diagram for plotting form
| Field | Description |
|---|---|
| Filename | The location for the string file to create. |
| Hole id | A list of the drillholes that are selected. |
| Z min | The minimum elevation of the section. |
| Z max | The maximum elevation of the section. |
| Downhole datapoint interval | The interval spacing for points generated when plotting the drillhole trace. The default value is one point per metre. |
| Interval for plotting depths | The interval at which points are extracted to plot downhole depths on the drillhole section. This value must be a multiple of the Downhole datapoint interval value, or zero if downhole depths are not required for plotting. The downhole depths are stored in the D1 field of the string file that is created. |
| Define the sample tables | The name of the interval and point tables that sample data is extracted from. You can select a maximum of five tables. |
| Define the geology tables | The name of the tables that geology data is extracted from.You can select a maximum of five tables. |
| Define the diplog table | The name of the point table that the diplog data is extracted from. This table should include optional fields to record the dip, azimuth and quality of the dipmeter readings down the hole. |
After you apply the Extract section fence diagram for plotting form the Define sample fields for plotting form appears.
Fields on the Define sample fields for plotting form
| Field | Description |
|---|---|
| Process each element separately |
|
| Combine adjacent samples |
|
| Define the sample fields and their plotting characteristics | |
| Field Name | The name of the sample field extracted for plotting. |
| Class Range | The range used to classify the sample values. For example 0,10,2;999 which is interpreted as dividing samples into 6 classes 0-2, 2-4, 4-6, 6-8, 8-10 and 10-999. |
| Bulking Threshold |
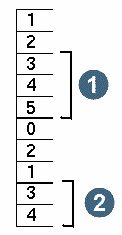
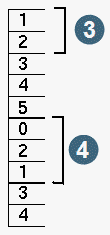
The value above or below which samples are bulked (grouped and averaged). If you enter a positive value, consecutive values above the threshold are bulked. If you enter a negative value, consecutive values below the threshold are bulked. You should enter zero if bulking is not required. Bulking threshold = 3
1. 3 m @ 4 2. 2 m @ 3.5 Bulking threshold = -2
3. 2 m @ 1.5 4. 3 m @ 1 |
| Decimals | The number of decimal places used to format the sample values for plotting. |
| Graphs |
The type of graph to create from the sample data. The data will be stored in a string file which you can then use in Plotting.
|
| Graph Location | The location of the graph, on the left or right of the drillhole trace. |
| Length per Unit | The size of the graph as a measure per sample value unit. |
| Maximum Value | The maximum sample value plotted in the graph. Sample values above this specified value are plotted as this maximum value. |
After you apply the Define sample fields for plotting form the Define geology fields form appears.
Fields on the Define geology fields form
| Field | Description |
|---|---|
| Combine adjacent samples |
|
| Define geology fields and their plotting characteristics | |
| Field Name | The name of the geology field extracted for plotting. |
| Geology Location | The location of the graph on the plot. |
| Box Size | The width, in real world units, of the box. |
After you apply the Define geology fields form the Define dipmeter data form appears.
Fields on the Define dipmeter form
| Field | Description |
|---|---|
| Dip field name | The name of the field, in the diplog table, containing the dip value. |
| Azimuth field name | The name of the field, in the diplog table, containing the azimuth value. |
| Quality field name | The name of the field, in the diplog table,containing the value for the quality of the dip and azimuth readings, between a (good) and e (poor). |
| Dip segment position | The location of the dip meter reading on the plot - left or right. |
| Dip segment length | The length, in real world units, of the dip meter segments on the plot. |
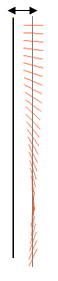
| Dip segment offset |
The offset from the drill hole trace to the centre of the dip meter segments, in real world units.
|
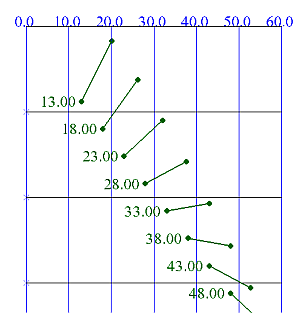
| Tadpole location | The name of the string file created for the grid and point values if a tadpole plot is required. This field is left blank if no tadpole plot is required. |
| Tadpole tail length | The length, in real world units, of the tadpole line segment plotted. |
| Elevation grid interval | The interval of the elevation grid lines on the y-axis of the tadpole grid. For example, a value of 10 would mean a horizontal grid line is plotted every 10 metres, in the metric system. |
| Dip grid interval | The interval of the dip grid lines on the x-axis of the tadpole grid. For example, a value of 10 would mean a vertical grid line is plotted every 10 metres, in the metric system. |
| Dip scale (deg/plot unit) | The number of degrees per unit for the dipmeter plot dip axis. For example, a value of 1 would mean one degree per metre, in the metic system. |
| # of dip grid intervals |
The number of grid intervals along the x-axis. This defines the maximum grid value on the x-axis of the tadpole grid, where the maximum value is the multiple of the Dip grid interval and the # of dip grid intervals. The example below had the following settings;
|
Output
A string file is created containing the section and dip meter information. If you have selected a tadpole plot a second string file is created containing the section and information for the tadpole grid.
Troubleshooting
| Message | Description |
|---|---|
Warning: Fence diagrams require at least two drillholes to be selected.
|
You must select more than one drillhole to run this function. |
Warning: Adjacent drillholes WRC008 are the same. This is not permitted. Please ensure adjacent drillholes in the list of selected holes are not identical.
|
You have selected the same drillhole twice. You need to remove one instance of the drillhole you have selected twice. |