


Linear Regression
This function allows you to nominate two numeric fields from a table in your database, as the X and Y axes of a graph. The data are extracted from these fields into a string file along with the graph axes and the line of best fit. A scatter diagram plot can then be created demonstrating the correlation between the two data sets. This can be useful to compare sample or drill hole characteristics.
For example, X may be copper grades and Y the corresponding zinc grade of a sample. Alternatively X may be the thickness of a contaminant plume and Y the corresponding average concentration or X may be the copper grade and Y the specific gravity.
To run this function: Choose Database > Analysis > , or...
Table name
Enter the name of the database table that you wish to use. Then choose Apply to display the LINEAR REGRESSION OF ASSAYS form.
Define the string file to create
Enter the Location and ID number of the string file that will contain the results of the linear regression.
Define the sample fields for regression analysis
Define the fields from the database that will be used for the Y-axis and X-axis in the regression analysis. After these have been entered choose Apply to carry out the linear regression and return to the DATA ANALYSIS submenu.
When you first select Linear Regression from the submenu, a list of the available tables in the current database will be displayed in the message window. After you have selected a table to use, a list of the available fields in that table will be displayed in the message window. Upon completion of processing the name of the output string file will be displayed in the message window. The output from the Linear Regression is a string file containing the following fields
You can view the resulting string file, or use the string file as input for a hard copy plot.
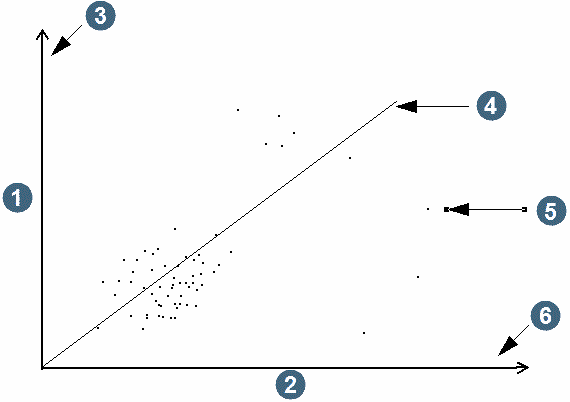
|
1. ZINC 2. COPPER 3. string 1 4. string 200 5. string 100 6. string 2 |
Table Statistics
With this function you can calculate basic statistics of the data which are stored in numeric fields in tables in the database. Statistics can be calculated for both untransformed data and for log transformed data (logarithms taken to base e). The statistics are:
- Number of samples
- Minimum value
- Maximum value
- Mean
- Variance
- Standard deviation
- Skewness
- Kurtosis
- Coefficient of Variation
To run this function: Choose Database > Analysis > Table statistics, or...
On completion of calculating the statistics, the results are displayed on a data entry form for perusal as well as being written to a '.not' file for printing.
The standard method of applying query constraints can be applied to the data for which statistics are to be calculated to limit to data set.
Fields on the Database table statistics form
Define the note file to create
Location and ID number
The results of the function are written to a formatted note file for later printing or inclusion on a plot. You must identify the note file (.not) which is to be created by entering the Location and ID number here.
Table
Enter the name of the table from which data is to be extracted for the calculation of statistics.
Use Logarithms
Respond with "Y" to calculate and report statistics on both untransformed data and on data for which logarithms to base e have been determined. To only calculate statistics on untransformed data respond with "N".
Lognormal statistics are useful if the data exhibits the characteristics of a log-normal distribution.
Complete the DATABASE TABLE STATISTICS form and choose Apply to display the DATABASE TABLE STATISTICS - REQUIRED FIELDS form.
Database table statistics - required fields form
Table
The name of the table from which the data are to be extracted is displayed for reference.
Field
Enter the name of the fields in the table for which statistics are to be calculated. It is only possible to choose fields whose data types are integer or real, it is nonsensical to calculate statistics of character data. Statistics on numerous fields can be calculated on one pass through this function.
Min Value
Enter the lower limit for values which are to be included in the sample population for the calculation of statistics. Any samples which are less than this value will be ignored.
Max value
Enter the upper limit for values which are to be included in the sample population for the calculation of statistics. Any samples which are greater than this value will be ignored.
Cut Value
A technique which is sometimes used for dealing with extremely high values is to reduce, or cut, them to some predetermined value. Enter the value which will be used to cut high values prior to including the sample points in the sample population.
Complete the DATABASE TABLE STATISTICS - REQUIRED FIELDS form and choose Apply to display the DEFINE QUERY CONSTRAINTS form. Complete the DEFINE QUERY CONSTRAINTS form and choose Apply to commence calculation of the statistics for the selected fields.
When the statistics have been calculated the DATABASE TABLE STATISTICS - RESULTS form is displayed to allow you to peruse the results. You may need to use the horizontal and vertical scroll bars to view the results.
Database table statistics - results form
Reporting criteria
Min Value, Max Value, Cut Value
The reporting criteria which were entered on the DATABASE TABLE STATISTICS - REQUIRED FIELDS form are displayed for reference.
Normal Statistics Num Samps
The number of samples in the sample population.
Minimum
The minimum value in the sample population.
Maximum
The maximum value in the sample population.
Mean
The arithmetic mean of the sample population.
Variance
The variance of the sample population.
Std Dev
The standard deviation of the sample population. This is equal to the square root of the variance.
Skewness
This is a measure of the symmetry of the distribution. In a normal distribution, where the distribution is symmetric, the skewness is zero. The skewness is negative for distributions tailing to the left and positive for distributions tailing to the right.
Curtosis
This is a measure of how peaked the distribution is, or the steepness of ascent near the mode of distribution. It has a value of zero in a normal distribution and so is a good test for distribution normality. Most gold deposits display a very steep curve near the mode of the distribution so the value for the curtosis can be expected to be quite high.
Coeff Var
This is a measure of the relative variation of the data and is calculated by dividing the standard deviation by the mean of the distribution. It provides a very useful guide to the variability of the data and their subsequent suitability for use in geostatistics. As a general rule, those distributions with a coefficient of variation less than one should produce a reasonable variogram model:
- if the coefficient of variation is greater than one it implies that the data are quite variable and it is difficult to produce a good variogram model;
- if the coefficient of variation is greater than two there is virtually no chance of producing a good variogram model.
Logarithmic statistics
The logarithmic statistics which are displayed are the same as those for the normal statistics with the exception that the data are first transformed by taking logarithms to base e (natural logarithms). Note that samples whose value is less than or equal to zero are disregarded from the logarithmic calculations and so it is possible to get different populations for the normal and lognormal statistics.
After perusing the results which are displayed on the DATABASE TABLE STATISTICS - RESULTS form choose Apply to create the note file which contains the results suitable for printing or plotting. An example of the results in the note file are shown below.
SURPAC2 TABLE STATISTICS Page : 1 Database : gold Date : 09-Jan-95 Field : gold Reporting Criteria Minimum value : 0.000 Maximum value : 999.000 Cut Value : 999.000 Normal Statistics Log Normal Statistics Number of samples : 809 Number of samples : 809 Minimum : 0.020 Maximum : 20.670 Mean : 1.496 Mean : -1.215 Variance : 9.217 Variance : 3.333 Standard Deviation : 3.035 Standard Deviation : 1.825 Skewness : 3.050 Skewness : 0.443 Curtosis : 13.473 Curtosis : 2.188 Coef of Variation : 2.028 Coef of Variation : -1.502 Field : silver Reporting Criteria Minimum value : 0.000 Maximum value : 999.000 Cut Value : 999.000 Normal Statistics Log Normal Statistics Number of samples : 847 Number of samples : 847 Minimum : 0.020 Maximum : 92.250 Mean : 4.493 Mean : -0.333 Variance : 111.110 Variance : 4.093 Standard Deviation : 10.540 Standard Deviation : 2.023 Skewness : 4.106 Skewness : 0.239 Curtosis : 23.747 Curtosis : 2.111 Coef of Variation : 2.345 Coef of Variation : -6.075 |