Block model report
The report created by this function is usually used in resource evaluation to determine the metal content of an orebody. The block model report allows you to summarise the content of the block model in an easy-to-use format.
To run this function: Choose Block model > Block model > Report, or...
There are two types of report output available, a Standard Report and a Multiple Percent Report.
With this function you can create a customised report, of the data stored in the block model, that is suitable for printing. The report may contain average or aggregate values for any of the numeric attributes stored in the model (weighted by volume, mass, or unweighted). The report can group or order the results by any attribute in the model, including dimension (that is, X, Y, or Z dimension). You can determine mass using a constant for the specific gravity or by using an attribute field in the model for the specific gravity.
The block model report also allows you to perform calculations on the output values. For example, you could choose to report two elements, calcium and silicon, if both of these elements exist as attributes in the model. You can then output a third column, which is a calculation of the ratio of calcium to silicon. As with all functions in the block model, you can apply a constraint to the model while processing the report.
Fields on the Block model report format file form
| Field | Description |
|---|---|
| Format File Name |
The name of the format file that you wish to use. If you wish to create a format file, type the name of a file which does not exist, and you will be asked to define the report, which will then be saved to the specified format file. You do not need to specify a format file if you do not wish to. |
| Output Report File Name |
The name of the output file (without extension) that you wish to output the report to. |
| Output Report File Format |
The file formats of the report. These are:
|
| Report Type |
|
| Indicator Kriged Model |
|
| IK model attributes | |
| Cumulative frequency and average grade between cutoffs |
This is the Surpac method for calculating cutoff data, it uses the ikc attributes to determine the cutoff data and is only available when the indicator kriged model option is selected. volume of a block = ( _ikc#data#4 - _ikc#data#2 ) * volume |
| Grade and tonnage for each cutoff |
This option is for use with the Schofield indicator kriged models. It provides a form for selecting the appropriate cutoffs using the grade and tonnage attributes in the model. The model being used must contain attributes that have the grade above a cutoff and tonnage above that same cutoff. For each cutoff a specific cutoff value must be specified. tonnage for cutoff = t2p0 - t4p0
The grade attribute to use for a particular cutoff. For this method the attribute should contain the average grade above the specified cutoff. The first row should contain the average grade above zero because this is used for calculating the rest of the values. The tonnage attribute to use for a particular cutoff. For this method the attribute should contain the tonnage above the specified cutoff. The first row should contain the total tonnes above zero because this is used for calculating the rest of the values. The cutoff value for the attributes specified. It can be any decimal value. |
| Value between cutoffs | |
| From string file |
This option brings up the IK block value estimate form for you to select a file to determine means between cutoffs
|
| Mean value |
This option displays the Select cutoff attributes form so you can manually enter cutoff values.
|
| Modify Format |
This check box is only active when you are using an existing format file.
|
| Constrain? |
|
 A sample calculation used for this method for a cutoff between 2 and 4
  Note: When modifying indicator kriged format files, you cannot change the method between cumulative, and grade and tonnage.
| Field | Description | ||||||||||||||||||||||||
|---|---|---|---|---|---|---|---|---|---|---|---|---|---|---|---|---|---|---|---|---|---|---|---|---|---|
| Report description |
The header for the report. This can be of any length. It can include line breaks and tabs. |
||||||||||||||||||||||||
| Format headers? |
|
||||||||||||||||||||||||
| Remove lines with zero volume? |
|
||||||||||||||||||||||||
| Report volume and tonnes to | The number of decimal places in the volume and tonnage that is reported. | ||||||||||||||||||||||||
| Report attributes |
You can include as many attributes as you wish in the final report. For each attribute listed, the report width is extended by another column of results.
|
||||||||||||||||||||||||
| Display? |
|
||||||||||||||||||||||||
| Low cut |
This field is only available when reporting an indicator kriged attribute. It contains the range of cutoff values as specified by the cutoff form. This value must be lower than the upper cut value. |
||||||||||||||||||||||||
| Upper cut |
This field is only available when reporting an indicator kriged attribute. It contains the range of cutoff values as specified by the cutoff form. This value must be greater than the lower cut value. |
||||||||||||||||||||||||
| Weight by |
|
||||||||||||||||||||||||
| Report |
|
||||||||||||||||||||||||
| Expression |
A powerful feature of the block model report is the ability to enter an expression to calculate on the attribute values in the block model report. The expression entered here uses the standard Expression syntax.
No calculations are performed until the final stage before outputting the report. At the final stage, the totals for all the true attributes are calculated, ready to be output to the report, and the calculations are performed. If you need a calculation to be performed while the report is generating, you must create a calculated attribute, and then report as if that calculated attribute was a normal attribute. To demonstrate how calculated fields work, imagine you have two attributes in your model, Ca and Si. They contain grades for calcium and silicon respectively. You want a calculation of the volume weighted ratio of Ca to Si. The following table shows how you would enter this in the Block Model Report form:
As you can see, you reference the two true block model attributes by the row letter assigned to them. This way, if you wish to, you can use the same attribute, but weighted differently, more than once in the same calculation. This would be impossible if you entered the name of the attribute in the calculation. It is perfectly valid to use one calculated report column inside another calculation, in the example above, we could create another row, and have the expression c*100... . There are also two special values you can use. You can use Tonnes and Volume to get those values, if you wish to use them in your calculation. Therefore, letters for the rows, Tonnes and Volume are the only valid variables you can use in your expressions. The only other invalid thing you can do is use a cyclic expression. For example, if you had row d with an expression e+50, and row e was d*10 this would create an invalid cycle. |
||||||||||||||||||||||||
| Volume adjustment | |||||||||||||||||||||||||
| Use volume adjustment? |
|
||||||||||||||||||||||||
| Attribute |
Select the attribute that contains the volume adjustment factor, expressed as a ratio. |
||||||||||||||||||||||||
| Geometric grouping | |||||||||||||||||||||||||
| Group geometrically |
The method of geometric grouping used for reporting the block model volume. Geometric grouping can be useful if you want to separate the report into different zones or areas.
The other fields that appear in this area depend on the geometric grouping method selected. |
||||||||||||||||||||||||
| File Name |
The name of the string or 3DM file used for the grouping. This field is available if you select Solids or Strings in the Group geometrically field. |
||||||||||||||||||||||||
| Object range |
The object number of the 3DM. This field is available if you select Solids in the Group geometrically field. |
||||||||||||||||||||||||
| String range | The numeric string range. This field is available if you select Strings in the Group geometrically field. | ||||||||||||||||||||||||
| Extension direction | If a string is selected, specify the X, Y, or Z direction. This field is available if you select Strings in the Group geometrically field. | ||||||||||||||||||||||||
| Lower bound | The lower value for the extension direction. This field is available if you select Strings in the Group geometrically field. | ||||||||||||||||||||||||
| Upper bound | The upper value for the extension direction. This field is available if you select Strings in the Group geometrically field. | ||||||||||||||||||||||||
| Top DTM file | The name of the top surface. This field is available if you select Between DTMS in the Group geometrically field. | ||||||||||||||||||||||||
 [Refresh] [Refresh] |
Loads the Object ID and Trisolation ID drop-down lists with the objects and trisolations of the DTM. In Surpac 6.6.1 and earlier versions, when you selected a DTM in the Location field, Surpac would load the DTM, validate it, and then load the Object ID and Trisolation ID drop-down lists. You could not interact with the form until the process was complete, which could be a long time for some large DTMs. Now, Surpac does not load the drop-down lists until you click the Refresh button, and validation does not occur until you click Apply in the form. Any validation errors are reported in the Message window. |
||||||||||||||||||||||||
| Object ID | The object number to be used for the top surface. This field is available if you select Between DTMS in the Group geometrically field. You can type the Object ID or select it from the drop-down list, if the list is loaded. | ||||||||||||||||||||||||
| Trisolation ID | The trisolation number to be used for the top surface. This field is available if you select Between DTMS in the Group geometrically field. | ||||||||||||||||||||||||
| Bottom DTM file | The name of the bottom surface. This field is available if you select Between DTMS in the Group geometrically field. | ||||||||||||||||||||||||
|
[Refresh] |
Loads the Object ID and Trisolation ID drop-down lists with the objects and trisolations of the DTM. |
||||||||||||||||||||||||
| Object ID | The object number to be used for the bottom surface. This field is available if you select Between DTMS in the Group geometrically field. You can type the Object ID or select it from the drop-down list, if the list is loaded. | ||||||||||||||||||||||||
| Trisolation ID | The trisolation number to be used for the bottom surface. This field is available if you select Between DTMS in the Group geometrically field. | ||||||||||||||||||||||||
| Boundary string file | The string file to constrain your surface grouping to a specific boundary. This field is available if you select Between DTMS in the Group geometrically field. | ||||||||||||||||||||||||
| String range | The string range for the boundary string. This field is available if you select Between DTMS in the Group geometrically field. | ||||||||||||||||||||||||
| Use partial percentages? |
|
||||||||||||||||||||||||
| Precision |
The level of sub blocking for partial percentage calculations. |
||||||||||||||||||||||||
| Attribute to store partial percentage values |
The attribute that stores the partial percentage values that are calculated when the report is created. The attribute must be a real type attribute. You can store the partial percentage values in a new attribute by entering the name of an attribute, which does not already exist in your block model, in this field.
|
||||||||||||||||||||||||
| Density adjustment | |||||||||||||||||||||||||
| None | Only volume only is included in the report | ||||||||||||||||||||||||
| Attribute | The name of the attribute, in the block model, that contains the specific gravity. Volume and mass are included in the report. | ||||||||||||||||||||||||
| Value | The constant value for specific gravity. Volume and mass are included in the report. | ||||||||||||||||||||||||
| Grouping attributes | The method for grouping the attributes in the report. This can be numeric or by character. If you are grouping by a real numeric attribute, use a range to define the groups. If you are grouping by a character or integer attribute, the Define string groups form is displayed after you apply the Block model report form. The Define string groups form allows you to enter the values for grouping. You can group by more than one attribute or dimension. If you choose to group by multiple attributes, the order they are specified in the table will influence the format of the report. | ||||||||||||||||||||||||
| Numeric range | The range of values the attributes will be grouped by in the report. | ||||||||||||||||||||||||
| Fill all cells for the group attribute? |
|
||||||||||||||||||||||||
| Pivot compatible |
|
||||||||||||||||||||||||
| Field | Description |
|---|---|
| Report description |
The header for the report. This can be of any length. It can include line breaks and tabs. |
| Fraction/percent attributes for first level report group | |
| First level group label | The heading for the first column on the report. |
| Fraction/Percentage attribute | The attribute that contains the fraction or percentage of the feature you are reporting on. This is used for the first level of grouping in the report. |
| Report group label | The label for the fraction or percentage reporting group that will appear on the report in the first column, below the First level group label. |
| Specific gravity | The attribute containing, or fixed value for, the specific gravity for the report group. |
| Columns and attributes | |
| Define columns and attributes for this category | The category to define the columns and attributes for. This will be one of the report group labels from the previous table. |
| Report column label | The heading for the report column. This is the heading label that the information about the attribute in the third column of this table is listed under in the report. |
| Report |
|
| Attribute | The attributes that you want to include in your report. These must be numeric. The report will contain a column with the header you entered in the Report column label cell for each attribute you enter in this table. |
| Format headers? |
|
| Remove lines with zero volume? |
|
| Pivot compatible? |
|
| Fill all cells for the group attribute |
|
| Report volume and tonnes to | The number of decimal places in the volume and tonnage that is reported. |
| Fraction/percentage range |
|
| Define 2nd and subsequent groupings for the report | |
| Grouping attributes |
The attributes or dimensions that you want to use for grouping. These can be x, y, z, or any of the attributes you have listed in the Columns and attributes table. If you select a character or integer attribute, after applying the Block model report form, the Define string groups form is displayed. You use this form to select the character or integer values that you want to use for grouping.
|
| Numeric range | If you have chosen to group by a numeric attribute, the range of values for the groups. |
Result
A report is created containing the requested information. This report is suitable for printing, inclusion in word processing packages, web browsers, or spreadsheets.
An example of a simple report is shown below. If you look at the calculated column on the right, you will see the expression divides the total tonnage by the average grade. This demonstrates how the calculations work.
This is a demonstration Block Model Report, using a constraint of a. > BLOCK grade 1, generated for the Surpac help in January 2000
|
Tonnes / Grade |
|||||
|---|---|---|---|---|---|
|
1.0-2.0 |
|
|
|
|
|
|
Sub Total |
|
0 |
0 |
0.000 |
0.000 |
|
2.0-3.0 |
260.0-270.0 |
22050 |
44100 |
2.621 |
16825 |
|
Sub Total |
|
22050 |
44100 |
2.621 |
16825 |
|
3.0-4.0 |
260.0-270.0 |
110250 |
220500 |
3.544 |
62217 |
|
|
270.0-280.0 |
106575 |
213150 |
3.342 |
63779 |
|
|
280.0-290.0 |
11025 |
22050 |
3.785 |
5825 |
|
Sub Total |
|
227850 |
455700 |
3.461 |
131667 |
|
4.0-5.0 |
250.0-260.0 |
104125 |
208250 |
4.594 |
45330 |
|
|
260.0-270.0 |
263375 |
526750 |
4.554 |
115667 |
|
|
270.0-280.0 |
78400 |
156800 |
4.723 |
33199 |
|
|
280.0-290.0 |
33075 |
66150 |
4.744 |
13943 |
|
|
290.0-300.0 |
3675 |
7350 |
4.916 |
1495 |
|
Sub Total |
|
482650 |
965300 |
4.606 |
209574 |
|
Grand Total |
|
732550 |
1465100 |
4.190 |
349665 |
An example of a simple indicator kriged report is shown below. The numbers are for demonstration purposes only. As you can see the attributes in this format are rows instead of columns, this is only for indictor kriged reports to allow reports to contain many attributes without using too much column space.
This is a demonstration Block Model Indicator Kriged Report, unconstrained, generated for the Surpac help in January 2003
|
Y |
Attribute |
Volume |
Tonnes |
Average Grade |
|---|---|---|---|---|
|
9962.5-9987.5 |
Cutoff -0.0-0.6 |
9523 |
27902 |
0.0458 |
|
|
Cutoff -0.6-1.0 |
1321 |
3870 |
0.8090 |
|
|
Cutoff -1.0-2.0 |
1656 |
4853 |
1.3077 |
|
|
t1p0 |
7018 |
20562 |
0.188 |
|
|
|
|
|
|
|
9987.5-10012.5 |
Cutoff -0.0-0.6 |
14866 |
43557 |
0.0606 |
|
|
Cutoff -0.6-1.0 |
1723 |
5047 |
0.7758 |
|
|
Cutoff -1.0-2.0 |
832 |
2438 |
1.2904 |
|
|
t1p0 |
3469 |
10163 |
0.497 |
|
|
|
|
|
|
|
10012.5-10037.5 |
Cutoff -0.0-0.6 |
11939 |
34982 |
0.0438 |
|
|
Cutoff -0.6-1.0 |
1421 |
4164 |
0.7992 |
|
|
Cutoff -1.0-2.0 |
1395 |
4087 |
1.3431 |
|
|
t1p0 |
5681 |
16646 |
0.250 |
|
|
|
|
|
|
|
Grand Total |
Cutoff -0.0-0.6 |
36328 |
106441 |
0.0512 |
|
|
Cutoff -0.6-1.0 |
4465 |
13082 |
0.7931 |
|
|
Cutoff -1.0-2.0 |
3883 |
11378 |
1.3167 |
|
|
t1p0 |
3883 |
11378 |
1.150 |
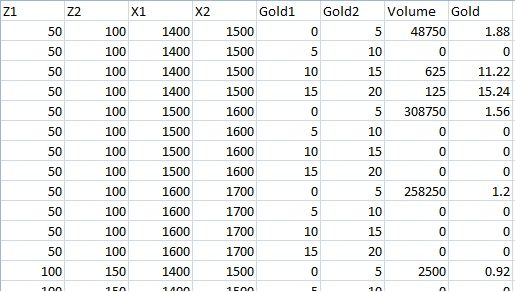
An example of the spreadsheet generated for a pivot table compatible block model report is below. The numbers are for demonstration purposes only.
This is a demonstration pivot table compatible Block Model Report, using a constraint of gold > 0, generated for the Surpac help in July 2011